Make Expense Ratio Impact Tangible: 6 Point Fee Checklist for Investors
See how expense ratios shave retirement balances. Dollarized examples, a six point fee checklist to compare funds, and tools to spot fee drag.
Make Expense Ratio Impact Tangible: 6 Point Fee Checklist for Investors

Expense ratios pull money directly out of your fund's assets every year, and that steady drain compounds against you the same way growth compounds for you. A measurable gap in expense ratios between two similar funds can cost thousands of dollars over several decades even on a modest starting balance. The scenarios below show exactly how, and the checklist near the end gives you a way to catch this in your own portfolio before it costs you.
TL;DR:
- A small difference in expense ratios can lead to thousands of dollars lost over decades due to the power of compounding.
- For a $10,000 investment growing at 7%, a 0.5% higher expense ratio can drain tens of thousands of dollars in the long term.
- Index funds typically have expense ratios under 0.40%, while actively managed funds often charge 0.40% to 0.70%, with higher costs needing justification.
- Paying higher fees is justified only if the fund demonstrates consistent alpha, niche strategies, or tax advantages that outperform the fee cost.
- Comparing net expense ratios, running dollarized scenarios, and avoiding overlapping or high-turnover funds are key steps to minimize fee drag.
Table of Contents
- What Is an Expense Ratio and What Does It Pay For?
- How Is an Expense Ratio Calculated?
- How Expense Ratio Impact Compounds Over Decades
- Typical Expense Ratio Ranges by Fund Type
- When a Higher Expense Ratio Might Be Justified
- Your Checklist for Comparing Fund Fees
- Tools for Tracking Fee Drag Across Your Portfolio
- The Real Lesson on Expense Ratios
- Sources
What Is an Expense Ratio and What Does It Pay For?
An expense ratio is the annual percentage of your fund's assets that gets deducted to cover the cost of running it. You don't write a check for it. Instead, the fund company takes it out of the fund's assets continuously, which quietly lowers the return you actually earn compared to the fund's gross performance.
That fee covers real operating costs, not padding for the sake of it:
- Management fees paid to the portfolio managers or the team running an index
- Administrative costs like recordkeeping, legal filings, and shareholder services
- Custody fees paid to the bank or institution holding the fund's assets
- Marketing and distribution costs, sometimes bundled as a 12b1 fee
- Auditing and accounting expenses required for regulatory compliance
Most prospectuses list two numbers worth knowing apart. The gross expense ratio is the full cost before any waivers. The net expense ratio reflects what you actually pay after the fund company waives or reimburses part of that cost, often temporarily to attract assets. The net figure is the one that matters for your actual return, but check whether a waiver has an expiration date buried in the fine print.
How Is an Expense Ratio Calculated?
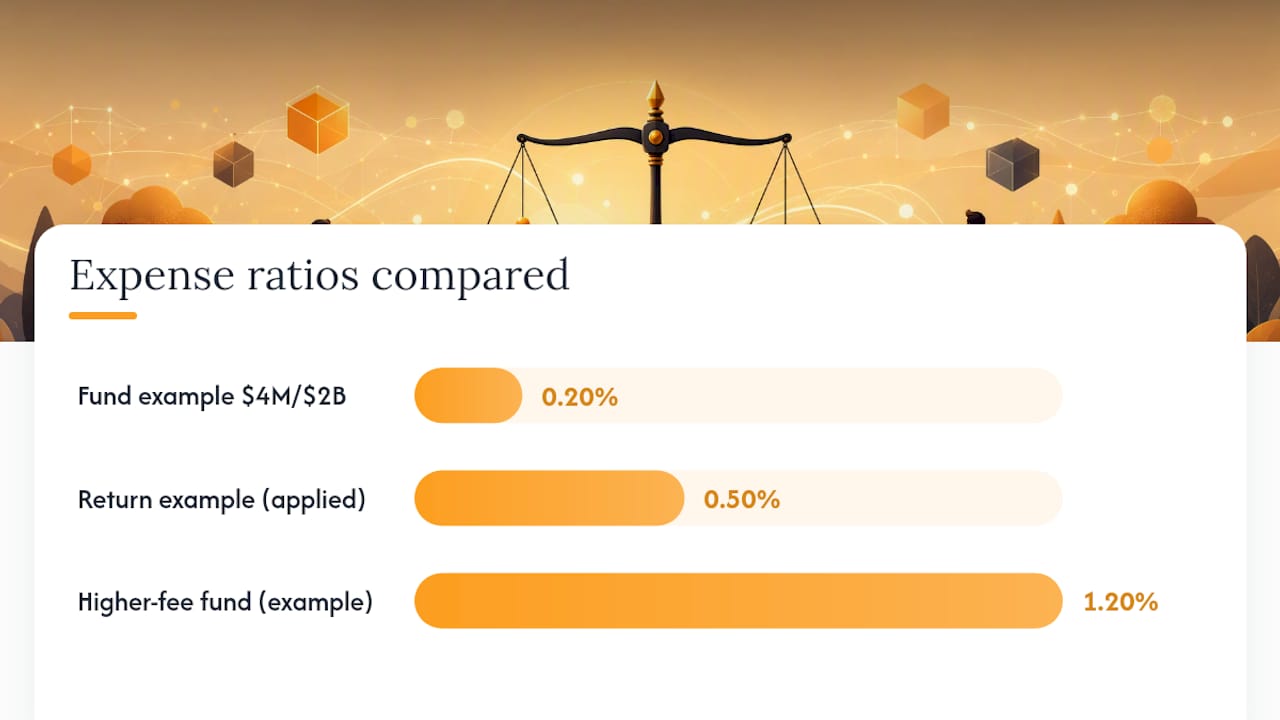
The formula behind an expense ratio is simple: total annual operating expenses divided by average net assets under management. A fund spending $4 million a year to operate with $2 billion in average assets has an expense ratio of 0.20%.
Here's how that number actually gets applied to your money:
- The fund calculates its total operating costs for the year and expresses them as a percentage of assets.
- That percentage is deducted incrementally from the fund's net asset value (NAV) throughout the year, not billed to you separately.
- Your reported return already reflects the deduction. If the fund's underlying holdings gained 8% and the expense ratio is 0.50%, your net return lands close to 7.5%.
- Over many years, that recurring subtraction compounds, because the money taken out each year can no longer grow alongside the rest of your investment.
A short example makes this concrete. Put $10,000 into a fund with a 0.20% expense ratio versus one with a 1.20% expense ratio, assuming both hold identical underlying investments earning 7% before fees. After one year, the difference is only about $100. After 30 years, as the next section shows, that gap turns into a five-figure hit.
How Expense Ratio Impact Compounds Over Decades
Here is the part that surprises most investors: the dollar cost of an expense ratio isn't linear. It compounds, because fees deducted early in your investing life remove money that would have kept growing for decades afterward. SmartAsset modeled this directly. Starting with $10,000 and holding two funds with identical gross returns, a modest difference in expense ratios can produce thousands of dollars more in cumulative fees over decades compared to a lower cost fund. Same market, same starting point, wildly different outcome.
Run the numbers on a larger, retirement-scale portfolio and the gap widens fast. Assume an initial investment growing at a 7% gross annual return, compounded annually, with no additional contributions. Over decades, differences in expense ratios can lead to tens of thousands of dollars in balance differences, highlighting the significant impact fees can have on long-term growth. That's not a rounding error. It's most of a second retirement account, lost entirely to fee drag rather than market performance.
Pro Tip: Don't just compare the percentage difference between two funds. Multiply it against your actual account balance and your expected investing horizon. A 0.5% gap sounds small until you see it as a dollar figure sitting next to your real retirement number.
The Investor frames this as an opportunity cost rather than just a nominal charge. Every dollar taken out in fees is a dollar that stops compounding for you, which is exactly why the gap between low and high expense ratios widens the longer your money stays invested. This is not a hypothetical concern reserved for the wealthy. It applies to any dollar amount, at any age, in any tax-advantaged or taxable account. The math scales proportionally, so a $25,000 account feels the same percentage-based drag as a $250,000 one, just with smaller absolute dollars at stake.
Industry data backs up why this deserves attention now more than ever, as seen in Wall Street Wants More From Ethereum — Fidelity's Latest ETF Move Says It All, illustrating how product innovation affects fees and competition. Asset-weighted average expense ratios for equity mutual funds have declined from around 1% in 2000 to roughly 0.40% today, and index equity ETFs average closer to 0.15%. Fee competition has genuinely helped investors, but only for those who actually shop around instead of defaulting to whatever fund a plan or advisor puts in front of them.
Typical Expense Ratio Ranges by Fund Type
Not every fund category costs the same to run, and knowing the typical range for each type helps you spot when you're paying too much. Passive index products are the cheapest to operate because they don't require a research team picking stocks.
- Equity index ETFs typically have very low expense ratios for major benchmarks.
- Bond index ETFs generally have low to moderate expense ratios, varying by strategy.
- Actively managed mutual funds usually have higher expense ratios than passive funds.
- Specialty and sector funds often carry higher expense ratios, reflecting more complex management and trading.
ETFs generally carry lower operating costs than mutual funds because of how their creation and redemption mechanics work, though you'll still want to watch bid/ask spreads and trading commissions as separate costs layered on top.
As a rule of thumb: under 0.40% is competitive for most core index exposure, 0.40% to 0.70% is reasonable for many actively managed funds, and anything above 1.5% needs a clear justification.
When a Higher Expense Ratio Might Be Justified
Paying more isn't automatically a mistake. Some strategies genuinely cost more to run, and the extra fee can be worth it if the fund delivers something a cheap index can't replicate.
- Active management with a demonstrated edge: a manager who consistently beats their benchmark net of fees, not just in one strong year.
- Access to niche or illiquid strategies: private credit, certain emerging markets, or specialized commodities that require expensive research and execution.
- Tax-efficient active management: funds designed to manage capital gains distributions for taxable accounts, which can offset a higher headline fee.
To judge whether the extra cost earns its place, look at alpha net of fees over multiple market cycles, not just the last 12 months. Check the turnover ratio, since high turnover often signals higher trading costs and tax drag on top of the stated expense ratio. Review consistency across both up and down markets, and confirm the fund is transparent about holdings rather than hiding behind vague strategy language.
Pro Tip: A red flag worth acting on immediately: a fund charging above-average fees that has trailed its benchmark net of fees for three years or more. Consistent underperformance plus a high fee is the combination to walk away from.
Your Checklist for Comparing Fund Fees
Comparing two funds properly takes about five minutes once you know what to check. Work through these steps every time you're deciding between similar options.
- Confirm both funds share the same objective. Comparing a large cap index fund against a small cap active fund on fees alone tells you nothing useful.
- Compare the net expense ratio, not the gross figure. Waivers expire, so check the prospectus for the waiver's end date if one applies.
- Check the turnover ratio. High turnover adds trading costs and tax consequences that don't show up in the expense ratio line itself.
- Run a dollarized scenario using your actual balance and time horizon. A 0.5% gap on $200,000 held for 25 years looks very different from the same gap on $5,000 held for three.
- Look for overlapping funds in your portfolio. Holding two funds that track nearly identical indexes means you're paying two fees for one exposure, something an ETF overlap analysis can reveal quickly.
- Ask your advisor or plan provider direct fee questions. Request the net expense ratio, any revenue-sharing arrangements, and whether lower cost share classes of the same fund are available.
| Question to ask | Why it matters |
|---|---|
| What's the net expense ratio, after waivers? | This is what you actually pay, not the marketing number |
| What's the turnover ratio? | High turnover adds hidden trading and tax costs |
| Is there a lower cost share class available? | Institutional or admiral share classes often cut fees significantly |
| Has this fund beaten its benchmark net of fees over 5+ years? | Justifies paying above the category average |
Resources like FINRA's investor tools let you verify an advisor's credentials and check for disclosed conflicts of interest tied to fee-based recommendations, which matters if you suspect a recommendation is driven by commission rather than performance.
Tools for Tracking Fee Drag Across Your Portfolio
Spotting fee drag manually across a dozen holdings is tedious, and that's exactly where most investors quietly lose track of it. A portfolio tracker worth using should show you the expense ratio for every fund you hold, not just the ones you remember to check, and it should let you model how a fee difference plays out over your actual time horizon rather than a generic 30-year example.

Evibe consolidates that view automatically. Once you sync your brokerage accounts, its ETF analytics surface the expense ratio for every fund side by side with performance and dividend data, so a high-cost holding doesn't hide inside a larger balance.
A practical workflow looks like this:
- Sync your holdings so every fund's expense ratio shows up automatically instead of requiring you to dig through prospectuses one by one.
- Run a fee scenario comparing your current holding against a lower cost alternative with a similar objective.
- Set a smart alert for any fund whose expense ratio sits meaningfully above its category average.
- Cross-check dividend reinvestment and net returns to confirm fees aren't quietly eating into your yield on cost.
The Real Lesson on Expense Ratios
Most articles on this topic stop at "fees matter," which is true but useless without a number attached. The actual lesson is that expense ratio impact is entirely predictable and entirely avoidable for the vast majority of portfolios. You're not gambling on whether a low-cost index fund will beat an expensive active fund. You're gambling on whether the active manager can overcome a headwind that compounds against them every single year, for as long as you hold the fund.
The conventional advice to "just check the expense ratio" undersells the problem. A single percentage point looks trivial on a fact sheet. It stops looking trivial once you multiply it against your actual balance and time horizon, which is why the dollarized scenarios matter more than the percentage itself.
For most people, that number is uncomfortable enough to prompt a real conversation with an advisor or a switch to a lower cost alternative.
— Vincent
This article is general information, not a substitute for advice from a qualified financial advisor. Consult a qualified financial professional about your own circumstances before acting on anything here.