Portfolio Benchmarking: A Practical Guide for Investors
Unlock the potential of your investments with effective portfolio benchmarking. Learn how to measure risk and return against market standards.
Portfolio Benchmarking: A Practical Guide for Investors

Portfolio benchmarking is the process of measuring your portfolio's return and risk against a relevant market index or custom policy benchmark, then acting on what the gap tells you. Before you run a single calculation, confirm three things:
- Asset-class alignment: Does your benchmark reflect what you actually hold? A 60/40 portfolio compared to the S&P 500 alone is comparing apples to a fruit basket.
- Return convention: Is your benchmark using total return (dividends reinvested) or price return only? Mismatching these inflates or deflates apparent outperformance.
- Time-horizon match: Does the evaluation window align with your strategy's intended holding period? A 6-month window tells you almost nothing about a 10-year mandate.
If any of these three are off, fix them before drawing any conclusions.
Key Takeaways
Effective portfolio benchmarking requires matching your benchmark to your actual asset mix, using risk-adjusted metrics, aligning return conventions, and embedding the review in a consistent governance cadence.
| Point | Details |
|---|---|
| Match benchmark to asset mix | A blended policy benchmark reflecting your target allocation gives more accurate signals than any single index. |
| Use risk-adjusted metrics | Alpha, Sharpe ratio, and information ratio reveal whether returns reflect skill or market exposure. |
| Align return conventions | Confirm whether your benchmark uses total return or price return; mismatching inflates or deflates apparent performance. |
| Set evaluation windows deliberately | Use 3-year, 5-year, and full-cycle windows; short windows mislead for long-horizon strategies. |
| Evibe automates the workflow | Evibe syncs accounts automatically, computes core benchmarking metrics, and tracks performance against major indices in one dashboard. |
Table of Contents
- What portfolio benchmarking actually means
- How to choose the right benchmark for your portfolio
- Core metrics that go beyond headline returns
- A step-by-step benchmarking workflow
- Common benchmarks and sample blended allocations
- Common benchmarking mistakes and how to avoid them
- How to interpret results and what to do next
- How Evibe supports the benchmarking workflow
- The part most investors get wrong about benchmarking
- Evibe gives you a faster path to defensible benchmarking
- Sources
What portfolio benchmarking actually means
Portfolio benchmarking is the practice of comparing a portfolio's returns and risk characteristics to a market index or combination of indexes used as a measuring stick. The benchmark answers a specific question: given the market environment and the risks taken, did this portfolio perform as expected, better, or worse?
Benchmarks serve three distinct purposes. First, they provide a relative return reference so you know whether outperformance reflects skill or simply a rising tide. Third, in fiduciary and institutional settings, benchmarks are governance tools that document the investment mandate and make oversight defensible.
Single-index benchmarks work well when a portfolio is concentrated in one asset class. A U.S. large-cap equity portfolio maps cleanly to the S&P 500. A broad U.S. investment-grade bond portfolio maps to the Bloomberg U.S. Aggregate Bond Index. For international developed-market equities, MSCI EAFE or MSCI ACWI are the standard references.
Custom or policy benchmarks are blended indexes weighted to mirror a portfolio's target allocation. Aggregate, this is the right approach for any diversified, multi-asset portfolio, and it is what most professional managers use as their primary reference point.
How to choose the right benchmark for your portfolio
Picking the wrong benchmark is the single most common benchmarking error. Here is a practical checklist to build or select one that holds up to scrutiny.
-
Match asset-class exposure. List every asset class in your portfolio and its target weight. Each class needs a corresponding index component. U.S. small-cap exposure maps to the Russell 2000; broad U.S. equity maps to the Russell 3000; international developed markets map to MSCI EAFE; emerging markets map to MSCI ACWI ex-U.S.
-
Match the investable universe. The benchmark's constituents should be securities you could realistically hold. A benchmark that includes illiquid micro-caps when your portfolio holds only exchange-listed ETFs creates a false comparison.
-
Align return conventions. Index return conventions vary across three types: price return (no dividends), net total return (dividends reinvested after withholding tax), and gross total return (dividends reinvested before withholding). Match the convention to how your portfolio's returns are calculated. For most U.S. taxable accounts, net total return is the closest match.
-
Account for currency and FX. If your portfolio holds international securities in foreign currencies, your benchmark must reflect the same FX exposure. A USD-hedged benchmark versus an unhedged one can diverge by several percentage points in a volatile FX year. Evibe's multi-currency tracking with historical FX rates handles this automatically.
-
Confirm pricing frequency. The benchmark must be priced at least as frequently as you calculate portfolio returns. Daily pricing is standard for liquid portfolios.
-
Verify investability and replicability. A good benchmark should be replicable with actual ETFs or funds. If a benchmark component has no investable proxy, it is difficult to act on any gap you find.
For fiduciary and oversight contexts, Cambridge Associates recommends formalizing this selection as a policy benchmark: a documented, pre-agreed reference tied directly to the portfolio's investment strategy and time horizon. The policy benchmark prevents the temptation to swap benchmarks retroactively when performance looks bad.
When to blend indexes: Any portfolio with more than one asset class should use a blended benchmark. Weight each index component by the portfolio's target allocation, not its current allocation. Rebalance the benchmark weights annually or whenever the policy allocation changes.
Pro Tip: Write your benchmark selection down before you start measuring. Choosing the benchmark after seeing results is a form of lookback bias, even when it feels like a reasonable adjustment.
Core metrics that go beyond headline returns
Raw return versus a benchmark is a starting point, not a conclusion. Risk-adjusted and attribution metrics separate what the market gave you from what your decisions actually contributed.
| Metric | What it measures | Interpretation note |
|---|---|---|
| Alpha | Return above what beta predicts | Positive alpha suggests selection or timing skill; check R-squared before trusting it |
| Beta | Sensitivity to benchmark moves | Beta > 1 means more volatile than the benchmark; beta < 1 means less |
| Sharpe ratio | Return per unit of total risk | Higher is better; use the same risk-free rate (typically 3-month T-bill) across all comparisons |
| Tracking error | Annualized std. dev. of return differences | Low tracking error signals index-like behavior; high tracking error signals active deviation |
| R-squared | How much variance is explained by the benchmark | R-squared below 0.70 means alpha/beta figures are unreliable for that benchmark |
| Information ratio | Alpha divided by tracking error | Measures consistency of active returns; above 0.50 is considered strong by most practitioners |
A few interpretation notes worth keeping in mind:
The alpha figure is then measuring noise as much as skill. Fix the benchmark first, then re-examine alpha.
Sharpe ratio depends on the risk-free rate. Use the 3-month U.S. Treasury bill rate consistently. Switching between the 10-year yield and the T-bill rate across different periods makes Sharpe ratios incomparable.
Risk-adjusted metrics often tell a more useful story than raw return because they separate market moves from what you earned per unit of risk. — CION Investments
Context is everything.
A step-by-step benchmarking workflow
The standard benchmarking workflow runs from data collection through to decision. Here is a practical sequence you can follow manually or with a portfolio tracker.
-
Select your benchmark. Apply the checklist from the previous section. Document the selection and the rationale before collecting any return data.
-
Collect return series. Gather portfolio returns and benchmark returns for the same periods. Use the same base currency. Confirm that both series use the same return convention (total vs. price).
-
Adjust for cash flows using TWR. For evaluating manager or strategy performance, use time-weighted return (TWR). TWR eliminates the distortion caused by the timing and size of contributions and withdrawals, making it the right metric for comparing to an index. Use money-weighted return (MWR), also called IRR, when you want to measure the actual dollar return to the investor, accounting for when capital was deployed.
-
Choose evaluation windows deliberately. Run comparisons across 1-year, 3-year, 5-year, and 10-year periods where data allows. Also test across at least one full market cycle that includes a significant drawdown period. Short windows mislead for long-horizon strategies.
-
Compute the core metrics. Calculate alpha, beta, Sharpe ratio, tracking error, R-squared, and information ratio as described in the previous section. Most portfolio software handles this automatically once you have clean return series.
-
Run attribution if available. Break down return differences into allocation effects (did you overweight the right sectors?) and selection effects (did you pick the right securities within each sector?). Even a rough attribution clarifies where the gap came from.
-
Test sensitivity to benchmark choice. Run the same metrics against two or three plausible benchmarks. If your conclusions flip depending on which benchmark you use, the benchmark choice is driving the story, not the portfolio's actual performance.
-
Draw conclusions and update if necessary. If the benchmark no longer fits the portfolio's actual exposures, update it prospectively. Never change it retroactively.
Pro Tip: TWR is the right measure for comparing to an index. MWR is the right measure for understanding your personal investment outcome. Both are useful; confusing them leads to wrong conclusions about whether a strategy is working.
Common benchmarks and sample blended allocations
Knowing which index to use for each asset class removes a lot of guesswork. Here are the standard single-index benchmarks for U.S.-based portfolios, followed by sample blended benchmarks for common allocations.
Standard single-index benchmarks:
- S&P 500: U.S. large-cap equities, market-cap weighted. The most widely cited equity benchmark in the United States.
- Russell 2000: U.S. small-cap equities. Use when your portfolio has meaningful small-cap exposure.
- Russell 3000: Broad U.S. equity market, covering approximately 98% of investable U.S. market cap. Better than the S&P 500 for portfolios that hold across the full cap spectrum.
- MSCI EAFE: Developed-market equities outside the U.S. and Canada. Standard for international developed-market exposure.
- MSCI ACWI: All-country world index, including both developed and emerging markets. Use for globally diversified equity sleeves.
- Bloomberg U.S. Aggregate Bond Index: Broad U.S. investment-grade fixed income, covering Treasuries, agency bonds, mortgage-backed securities, and corporate bonds. The standard fixed-income benchmark for most U.S. portfolios.
Sample blended policy benchmarks:
| Allocation type | Equity component | Fixed income component | Blended benchmark |
|---|---|---|---|
| growth | Russell 3000 | Bloomberg U.S. Aggregate Bond Index | Aggressive growth blend |
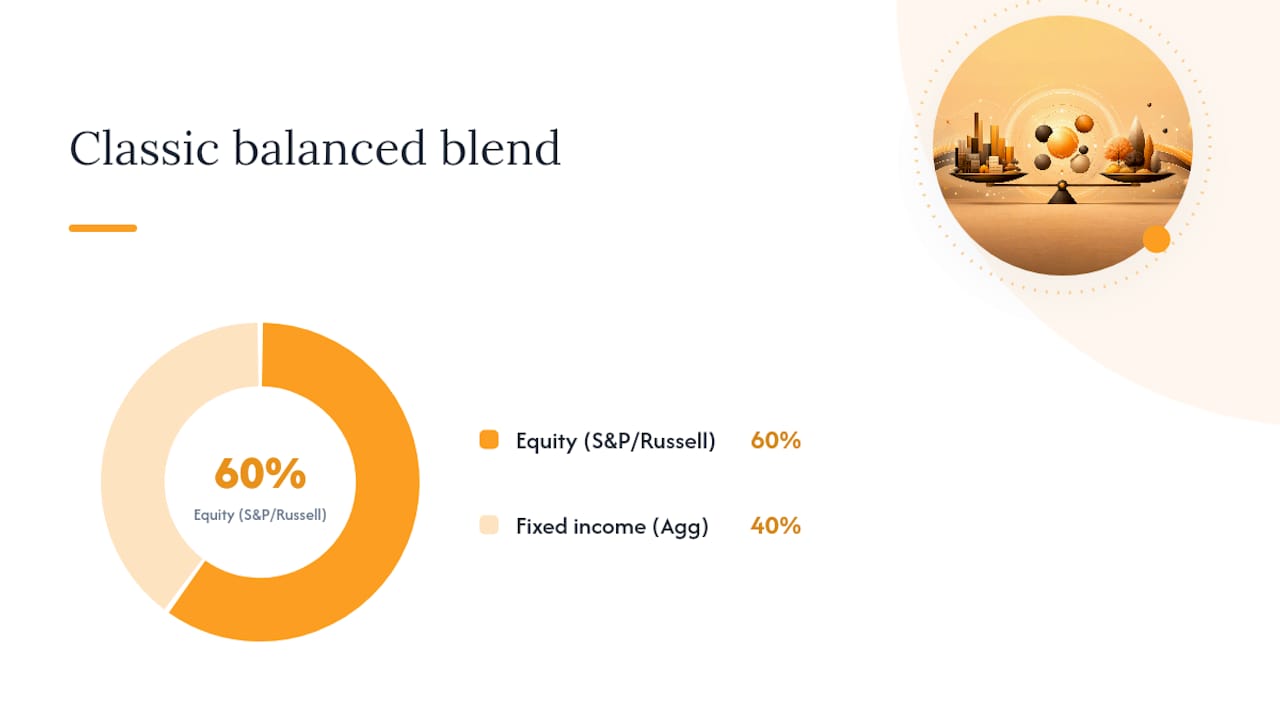
| 60/40 balanced | 60% S&P 500 or Russell 3000 | 40% Bloomberg U.S. Aggregate | Classic balanced blend |
| moderate | Russell 3000 | Bloomberg U.S. Aggregate Bond Index | Moderate growth blend |
For portfolios with international equity exposure, replace a portion of the equity component with MSCI EAFE or MSCI ACWI. Aggregate.
One practical constraint: if a benchmark component has no liquid ETF proxy, it is difficult to replicate and harder to act on. The Investopedia benchmarking guide recommends choosing benchmarks that align with your actual investable universe, which means preferring indexes with widely available ETF equivalents (SPY or IVV for S&P 500, AGG or BND for Bloomberg Agg, VEA for MSCI EAFE).
Common benchmarking mistakes and how to avoid them
Most benchmarking errors fall into a handful of recurring patterns. Knowing them in advance saves a lot of misleading analysis.
-
Benchmark mismatch. Comparing a diversified multi-asset portfolio to the S&P 500 is a common mistake retail investors make. During strong equity bull markets, such mismatched comparisons can make balanced portfolios seem to underperform, and during drawdowns, they may seem to outperform. Neither conclusion is useful. Use a blended benchmark that mirrors your actual target allocation.
-
Lookback and selection bias. Choosing a benchmark after seeing results, or selecting the evaluation window that makes performance look best, invalidates the comparison. The benchmark and the evaluation period must be set before the analysis, not after.
-
Return convention mismatch. Comparing a total-return portfolio (dividends reinvested) to a price-return index understates the benchmark's return and makes the portfolio look better than it is. Solactive's index guidelines detail how dividend treatment and withholding tax can materially change benchmarking results. Always confirm which convention each series uses.
-
Gross vs. net return comparison. Comparing gross portfolio returns (before fees) to a benchmark is misleading for any investor paying management fees or transaction costs. Use net-of-fee returns for a fair comparison.
-
Survivorship bias in custom benchmarks. If you build a custom benchmark using only indexes that have performed well historically, you are introducing survivorship bias. Stick to established, published indexes with long track records.
-
Short evaluation windows for long-horizon strategies. A 12-month window tells you almost nothing about a strategy designed for a 10-year horizon. Align evaluation periods with the strategy's stated time horizon, as Oregon State's investment benchmarking materials emphasize for governance contexts.
-
Ignoring FX effects for international holdings. A U.S. investor holding MSCI EAFE exposure in unhedged form will see returns that include currency moves. The benchmark must reflect the same FX treatment, or the comparison is measuring currency bets, not investment decisions.
How to interpret results and what to do next
Getting the numbers is the easy part. Acting on them correctly is where most investors stall.
When alpha is persistently negative with a well-matched benchmark: This is a signal to investigate, not immediately to act. First, confirm the benchmark is correctly matched. If it is, look at whether fees, taxes, or cash drag account for the gap. If those explain it, the portfolio is performing as expected. If they do not, review individual holdings or manager selection.
Tracking error above that level suggests either fee drag, cash holdings, or securities lending effects. Investigate before assuming active management is occurring.
When to adjust the benchmark: Adjust the benchmark prospectively when the portfolio's mandate or target allocation changes. Style drift, a shift from growth to value exposure, or the addition of a new asset class all justify a benchmark update. Document the change and the date. Never adjust retroactively.
Review cadence: Quarterly monitoring is appropriate for checking whether the portfolio is staying within its risk parameters. An annual deep-dive is the right cadence for a full benchmarking review: recalculate all metrics, check benchmark fit, run attribution, and assess whether the strategy is on track for its stated objectives.
Next steps after benchmarking: Run a formal attribution analysis to separate allocation and selection effects. Compare performance on risk-adjusted metrics, not just raw return. For goal-based investors, model whether the current trajectory meets the target outcome at the target horizon, not just whether it beats an index.
How Evibe supports the benchmarking workflow
Running a rigorous benchmarking process manually is time-consuming and error-prone. Evibe is built to handle the data-intensive parts automatically, so you can focus on interpretation and decisions.
Here is how Evibe's features map directly to the workflow steps above:
- Automatic account sync pulls live data from 1,000+ banks, brokerages and crypto exchanges across the US, Canada and Europe, eliminating manual data entry and reducing the risk of stale or mismatched return series.
- Multi-asset coverage consolidates stocks, ETFs, options, crypto, real estate, and other asset classes in one dashboard, so your portfolio return reflects everything you hold, not just your brokerage account.
- Benchmark comparison against major indices lets you track performance relative to the S&P 500, Russell indexes, and other standard benchmarks directly in the app.
- Built-in risk and performance metrics including alpha, Sharpe ratio, and tracking error give you the core benchmarking metrics without building spreadsheets.
- Dividend and cashflow tracking ensures that return calculations include dividend income, which is critical for matching total-return conventions. The dividend tracker covers executed, declared, and estimated dividends.
- Multi-currency support with historical FX rates handles international holdings correctly, so benchmarking a globally diversified portfolio reflects actual FX exposure rather than ignoring it.
- Smart alerts flag significant deviations from expected performance, supporting the quarterly monitoring cadence without requiring manual checks.
- ETF-specific analytics give you the granular data needed to benchmark ETF portfolios accurately, including expense ratios and underlying exposure.
Pro Tip: Automating data collection and return calculation removes the two biggest sources of manual benchmarking error: stale data and inconsistent return conventions. When the numbers update automatically, your review cadence becomes a discipline of interpretation rather than a data-cleaning exercise.
The part most investors get wrong about benchmarking
There is a version of portfolio benchmarking that is genuinely useful, and a version that just generates anxiety. Most retail investors practice the second version without realizing it.
The useful version treats a benchmark as a calibration tool. You use it to check whether your portfolio's risk exposures are doing what you intended, whether fees and taxes are eating into returns more than expected, and whether your asset mix still matches your actual goals. That is a quarterly discipline, not a daily one.
The anxiety-generating version treats the benchmark as a scoreboard. You check it after every market move, adjust holdings when you trail the S&P 500 for two quarters, and gradually drift toward whatever the index is currently overweight. That behavior tends to produce the opposite of outperformance: you end up buying high after strong index runs and selling low after drawdowns.
The behavioral discipline that actually matters is separating market-relative benchmarking from goal-based measurement. Your benchmark tells you whether your strategy is working as designed. Your financial plan tells you whether you are on track to meet your actual objectives. Both matter, but they answer different questions. Conflating them is what drives the performance-chasing behavior that erodes long-term returns.
A blended policy benchmark, reviewed annually with a documented process, is almost always more useful than a single-index comparison reviewed weekly. The frequency of review does not improve the quality of the signal. It usually degrades it.
Evibe gives you a faster path to defensible benchmarking
Most investors spend more time collecting and cleaning data than actually analyzing it. Evibe changes that ratio. With automatic syncing across all your accounts, built-in benchmark comparisons against major U.S. indices, and AI-driven analysis covering risk, diversification, and performance, you get a complete benchmarking picture without the spreadsheet overhead.

The app covers every asset class in one dashboard: stocks, ETFs, options, crypto, real estate, and more. The ETF tracker gives you benchmark-aware analytics on your fund exposures. Dividend tracking ensures your total-return calculations are accurate. Multi-currency support handles international holdings with historical FX rates. And smart alerts keep you informed when performance deviates from expectations, so your quarterly review starts with context rather than catch-up.
Evibe is free to use on iPhone and Mac through the App Store, with 7 days of Premium on every new account. If you want a benchmarking workflow that runs on real data rather than manual effort, that is the place to start.
Sources
The following sources were used in building this guide. Each covers a distinct aspect of benchmarking practice.
- Understanding Benchmarks | PIMCO
- 5 Key Metrics to Benchmark a Portfolio - CION Investments
- Policy benchmarking guide — Cambridge Associates
- Guideline — Solactive US Benchmark Index Series
- How to Use Benchmarks in Investing — Investopedia
This article is general information, not a substitute for advice from a qualified financial advisor. Consult a qualified financial professional about your own circumstances before acting on anything here.