Portfolio Dividend Calculator: Your 2026 Investor Guide
Use our portfolio dividend calculator to project future income, optimize your investment strategy, and plan smarter toward financial independence in 2026.
Portfolio Dividend Calculator: Your 2026 Investor Guide

A portfolio dividend calculator estimates your future passive income by projecting dividend payments, reinvestment effects, and portfolio growth across your entire holdings. You enter your starting capital, monthly contributions, allocation percentages, dividend yield, and growth rate assumptions, and the calculator returns projected monthly and annual income at 5, 10, 20, and 30-year time horizons. The core value is planning clarity: you can model whether your current strategy actually reaches a target income level, or how much more capital you need to get there.
Key outputs and use cases include:
- Projected monthly and annual dividend income at multiple time horizons
- Total portfolio value after compounding, contributions, and price appreciation
- DRIP vs. cash comparison showing how reinvestment accelerates income growth
- Income goal benchmarking to plan for retirement or financial independence
- Yield on cost (YOC) tracking to see how your effective yield rises over time
How to use a portfolio dividend calculator effectively
Getting accurate projections starts with entering realistic inputs. Most calculators, including tools like DRIPCalc and the StockAnalysis Dividend Calculator, follow a consistent input structure.
Step-by-step input process:
- Starting capital: Enter your current portfolio value or the amount you plan to invest initially.
- Monthly contributions: Add any recurring investment amount. Even modest monthly additions compound meaningfully over 15–20 years.
- Ticker symbols and allocation percentages: Advanced calculators let you add up to 20 individual tickers with custom weightings. Simpler tools use a single blended yield instead.
- Dividend yield: Use the current trailing yield for each position, or a blended portfolio yield if the tool aggregates it.
- Dividend growth rate: Set an annual growth assumption. The S&P 500 Dividend Aristocrats have historically averaged 7–8% annual dividend growth, which is a reasonable baseline for quality dividend portfolios.
- Price appreciation: Separate from yield, this models capital gains on your holdings. Covered call ETFs typically run 0–2%; dividend growth ETFs like SCHD run 5–8%.
- DRIP toggle: Activate reinvestment to model compounding, or disable it to see cash income projections side by side.
Once projections load, read the Year 10 and Year 20 columns first. Those horizons reveal whether your current inputs realistically reach your income goal. Adjust monthly contributions or yield assumptions until the projection aligns with your target.
Pro Tip: Apply a "haircut" to any projection by mentally reducing the output by 15–25% to account for taxes and fees. Most calculators show a best-case scenario with no tax drag, so real-world income will be lower in taxable accounts.
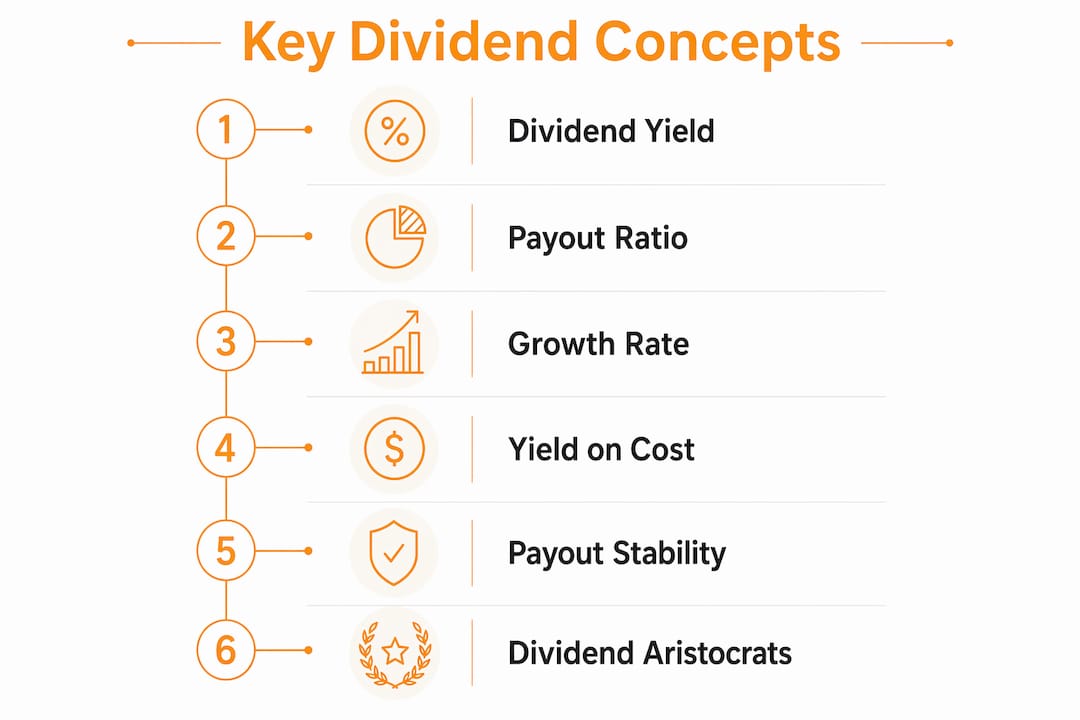
Key dividend concepts that drive your projections
Understanding the metrics behind the numbers makes calculator outputs far more useful.
1. Dividend yield
Dividend yield equals annual dividends per share divided by the current share price. A $40 stock paying $1.60 annually yields 4%. This is the starting point for every income projection.
2. Dividend payout ratio
The payout ratio measures what percentage of earnings a company distributes as dividends. Below 60% is generally sustainable; above 80% signals potential risk of a cut if earnings dip.
3. Dividend growth rate (DGR)
DGR is the annual rate at which a company raises its dividend. A modest 3% yield with a 10% DGR doubles income in roughly 7 years. A 6% yield with 2% DGR takes about 36 years to double. The compounding math strongly favors growth over raw yield.
4. Yield on cost (YOC)
YOC measures your dividend income relative to your original purchase price, not the current market price. A 3% yield purchased 15 years ago with a 7% annual DGR reaches approximately 8.3% YOC on the original capital. This metric is why long-term dividend growth investors focus on buying quality at reasonable prices.

5. Dividend payout stability
Chasing the highest current yield is one of the most common mistakes in dividend investing. Sustainability and growth history reduce risk and improve long-term returns more effectively than maximizing current yield alone.
6. Dividend Aristocrats and Kings
Dividend Aristocrats are S&P 500 companies that have raised dividends for 25 or more consecutive years. Dividend Kings extend that streak to 50 or more years. These companies form the backbone of many income portfolios because their growth history is verifiable. For a deeper look at how these two groups compare, the Dividend Kings vs. Aristocrats guide breaks down the key differences for portfolio construction.
Dividend reinvestment (DRIP): benefits, risks, and strategic use
DRIP is the single most powerful lever in a dividend portfolio. When you reinvest dividends instead of taking cash, each payment buys additional shares that generate their own dividends, which buy more shares. The result is exponential, not linear, growth.
Key benefits of DRIP:
- Double compounding: Both share count and dividend per share increase simultaneously, accelerating income growth beyond what either factor alone produces.
- Shorter timeline to income goals: DRIP can help you reach income goals several years faster than taking dividends as cash, depending on yield and growth rate.
- Accumulation phase advantage: During working years, reinvestment maximizes compounding. The transition to taking cash marks the moment the portfolio starts paying you back.
Risks and considerations:
- Tax drag in taxable accounts: Each DRIP event in a taxable brokerage account is a taxable transaction, even though you receive no cash. This creates a tax liability without the liquidity to pay it.
- Over-concentration risk: Automatic reinvestment into the same positions can increase sector or single-stock exposure over time without you noticing.
- Market volatility: Reinvesting during a downturn buys more shares at lower prices, which is actually beneficial, but it requires discipline not to stop reinvesting when prices fall.
When to take dividends as cash:
- During retirement, when you need the income to cover living expenses
- When a position has grown to an outsized allocation and rebalancing is overdue
- In taxable accounts where the tax cost of DRIP outweighs the compounding benefit
Pro Tip: Use DRIP in tax-advantaged accounts like IRAs and 401(k)s where reinvestment is tax-free, and consider taking cash dividends in taxable accounts to manage your annual tax bill more precisely.
How to interpret portfolio dividend growth projections
Calculator outputs are planning tools, not guarantees. Reading them correctly prevents overconfidence and poor allocation decisions.
What to watch for when reviewing projections:
- Constant yield assumption: Most calculators hold your input yield fixed for the entire projection period. In reality, yields fluctuate with price changes and dividend policy shifts.
- No market downturns modeled: Projections assume steady price appreciation. A bear market in year 3 can set back a 20-year projection significantly.
- Tax and fee exclusions: Projections typically show gross income. Tax treatments and fees reduce real dividend income, so treat outputs as a ceiling, not a floor.
- DRIP vs. no-DRIP gap: The difference between reinvested and cash projections widens dramatically after year 10. Use both scenarios to understand the true cost of taking income early.
- Income goal benchmarking: To generate $5,000 per month at a 4% yield, you need roughly $1.5 million invested. Use this as a calibration point when setting your own targets.
- Yield sustainability check: A projected yield above 6–7% warrants scrutiny. High yields often precede dividend cuts, which would invalidate the entire projection.
Financial planners recommend using dividend calculators as a compass for planning rather than a precise forecast. Adjust your inputs conservatively, run multiple scenarios, and revisit projections annually as your portfolio evolves.
What types of dividend calculators are available?
Not all dividend calculators serve the same purpose. The right tool depends on how much detail your planning requires.

Simple calculators take a single portfolio value, a blended yield, and a growth rate, then return annual income projections. They work well for quick estimates and back-of-envelope planning. The tradeoff is that they cannot model individual positions or allocation changes.
Advanced multi-ticker calculators let you enter 10–20 individual tickers with custom allocation percentages and per-ticker DRIP settings. Tools like DRIPCalc and the MarketBeat Dividend Calculator fall into this category. They produce detailed year-by-year breakdowns including shares owned, annual dividends per share, YOC, and after-tax income estimates. These are the right choice for investors managing a real diversified portfolio.
Customizable income planners go further by adding tax bracket inputs, contribution growth rates, and income milestone tracking. Some include a payment calendar showing which months each ticker pays, which matters for investors who rely on dividends to cover monthly expenses. For a broader comparison of tools in this category, the best dividend tracker apps guide covers the leading options in detail.
The StockAnalysis Dividend Calculator sits in the advanced tier, offering detailed projections with after-tax income columns and YOC tracking across a 10-year horizon. DRIPCalc adds a tax tab and a dividend payment calendar, making it one of the more complete free tools available. For retirement income planning specifically, pairing a dividend calculator with a broader retirement projection tool helps stress-test whether dividend income covers total living expenses.
What are the real limitations of dividend calculators?
Every calculator makes assumptions that can diverge significantly from reality. Knowing where the model breaks down keeps your planning grounded.
Core limitations to keep in mind:
- Static yield: Calculators fix your yield at the input value. If a holding cuts its dividend, the projection becomes inaccurate immediately.
- No sequence-of-returns risk: A market drop in the early years of a projection has an outsized negative effect that flat-growth models cannot capture.
- Tax exclusions: Most tools show pre-tax income. In taxable accounts, qualified dividends are taxed at capital gains rates, while ordinary dividends are taxed as income. Investors often apply a manual reduction to projections to reflect this.
- No fee modeling: Expense ratios on ETFs and brokerage transaction costs are not included. For high-yield ETFs with expense ratios above 0.5%, this gap is material over 20 years.
- Contribution growth not always modeled: Simple calculators assume a fixed monthly contribution. In practice, contributions often grow with income, which means projections may understate actual outcomes.
- Past dividend growth does not guarantee future increases: A company with a 15-year growth streak can still cut its dividend. Projections built on historical DGR assume that streak continues indefinitely.
Use calculator outputs as a directional guide. The most useful habit is running a conservative scenario (lower yield, lower growth, no DRIP) alongside an optimistic one to understand the range of plausible outcomes.
How Evibe enhances your dividend planning beyond a calculator
A standalone dividend calculator gives you a projection. Evibe gives you the live portfolio context to act on it.
Evibe consolidates stocks, ETFs, crypto, real estate, and other asset classes into a single dashboard with automatic syncing from 1,000+ banks, brokerages and crypto exchanges across the US, Canada and Europe. For dividend investors, the platform's advanced dividend tracking separates executed payments, declared upcoming dividends, and estimated future income, so you always know where your cash flows stand.
What Evibe adds to dividend portfolio management:
- AI-driven risk and diversification analysis: The app flags concentration risk, sector imbalances, and performance gaps against major indices automatically.
- Real-time data across all asset classes: Projections stay current without manual updates, unlike static calculator inputs.
- Smart alerts: Get notified when a holding's yield changes materially, a dividend is declared, or a position drifts outside your target allocation.
- Multi-currency support: For investors holding international dividend payers, Evibe handles FX conversion with historical rate data.
- Benchmarking: Track your dividend portfolio's total return against the S&P 500 or other indices to evaluate whether your income strategy is keeping pace.
| Feature | Standalone calculator | Evibe |
|---|---|---|
| Dividend income projection | Yes | Yes, with live data |
| Real-time portfolio sync | No | Yes, automatic |
| AI risk and diversification analysis | No | Yes |
| Executed vs. estimated dividend tracking | No | Yes |
| Multi-asset class consolidation | No | Yes |
| Smart alerts and benchmarking | No | Yes |
A dividend calculator tells you what your portfolio could earn. Evibe tells you what it is actually doing, right now, across every position you hold.

If you want projections grounded in real portfolio data rather than manual inputs, track your portfolio with Evibe and connect your dividend strategy to live account data from day one.
Key Takeaways
A portfolio dividend calculator is most useful when paired with realistic assumptions, tax awareness, and a live tracking tool that keeps your inputs current.
| Point | Details |
|---|---|
| DRIP accelerates income timelines | Reinvesting dividends can help you reach income goals 3–10 years faster than taking cash. |
| YOC rises with dividend growth | A 3% yield purchased 15 years ago with a 7% annual growth rate reaches approximately 8–10% yield on cost relative to the original capital. |
| Calculators show best-case scenarios | Tax drag and fees are excluded; apply a manual reduction for taxable accounts. |
| Income goal benchmark | Generating $5,000 per month at a 4% yield requires about $1.5 million invested. |
| Sustainability beats raw yield | A 3% yield with 7% growth outperforms a volatile 5–6% yield at risk of cuts over the long term. |