Dividend Income Calculator: Your 2026 Investor Guide
Discover how a dividend income calculator can boost your investment strategy. Learn to forecast earnings and plan for financial independence in 2026!
Dividend Income Calculator: Your 2026 Investor Guide

TL;DR:
- A dividend income calculator helps investors estimate earnings by inputting shares, dividends, and tax rates. Reinvesting dividends through DRIP can significantly boost long-term portfolio growth, especially during accumulation phases. However, actual dividend income varies due to market fluctuations, payout changes, and tax considerations.
A dividend income calculator is the tool that lets investors compute expected dividend earnings from stock holdings by applying a core formula: shares owned multiplied by annual dividend per share, adjusted for tax rate, payment frequency, and reinvestment options. Dividend income calculators estimate annual and monthly income, portfolio value, and yield, helping investors forecast passive income streams and model growth with reinvestment. Whether you are building toward financial independence or managing an income portfolio in retirement, understanding how these tools work gives you a concrete edge in planning your next move.
How to use a dividend income calculator
The standard formula for annual dividend income is straightforward: number of shares owned multiplied by the annual dividend per share. For quarterly dividends, multiply the quarterly payment by 4 to get the annual figure. A simple example: 200 shares paying $3.00 per share annually generates $600 in dividend income per year.

Most calculators extend beyond this base formula. They also compute dividend yield, after-tax income, monthly income equivalents, and projected portfolio value. Each output serves a different planning purpose. Monthly income tells you what hits your account regularly. After-tax income tells you what you actually keep.
The core inputs you need
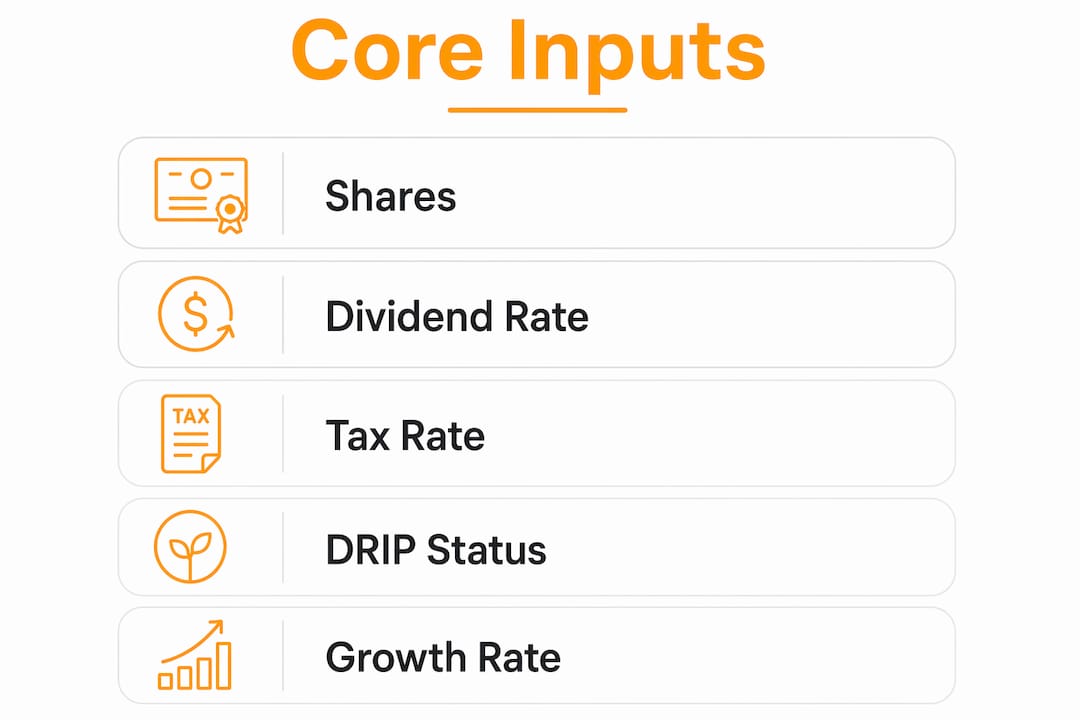
Getting accurate results requires accurate inputs. Here is what a well-built dividend estimator asks for:
- Number of shares owned. This is your starting position. Even a small error here compounds across all other outputs.
- Annual dividend per share. Use the most recent declared annual dividend, not an estimated or historical figure.
- Current stock price. The calculator uses this to compute dividend yield. Since dividend yield changes daily with stock price movements, always use the current market price.
- Payment frequency. Quarterly is most common for U.S. stocks, but some pay monthly or annually. The calculator adjusts accordingly.
- Tax rate. Qualified dividends are taxed at preferential rates of 0%, 15%, or 20%, while ordinary dividends from REITs are taxed at your regular income rate. Entering the wrong rate distorts your net income projection.
- DRIP selection. Choosing to reinvest dividends changes the long-term output significantly.
Pro Tip: If you hold dividend stocks across a taxable brokerage and a Roth IRA, run two separate calculations with different tax rates. The after-tax difference between accounts is often larger than investors expect.
The output side of a dividend estimator is equally worth understanding. Annual income and monthly income are the headline numbers. Yield tells you the return relative to current price. Portfolio value shows your total position. These outputs together let you compare holdings and model scenarios before committing capital.
How does DRIP affect long-term dividend growth?
A Dividend Reinvestment Plan, or DRIP, automatically uses your dividend payments to purchase additional shares instead of paying cash. This creates a compounding effect: more shares generate more dividends, which buy even more shares. Over time, the difference between DRIP and cash dividends is substantial.
Starting with $200,000 at a 3.5% yield and 5% annual growth, DRIP produces a final portfolio value of approximately $432,000 over 20 years. The same position taking cash dividends ends at roughly $265,000. That is a 63% higher portfolio value from reinvestment alone. The compounding effect is not gradual; it accelerates in the later years as the share count grows faster.
| Scenario | Starting Value | Final Portfolio (20 years) | Difference |
|---|---|---|---|
| DRIP enabled | $200,000 | ~$432,000 | +63% vs. cash |
| Cash dividends | $200,000 | ~$265,000 | Baseline |
The tipping point formula
There is a specific threshold where DRIP starts generating meaningful momentum. The tipping point formula equals 100 divided by the dividend yield percentage. At a 3.87% yield, you need approximately 26 shares for your dividends to buy one additional share per year. Once you cross that threshold, the reinvestment snowball accelerates on its own.
Pro Tip: DRIP works best during the accumulation phase of investing, roughly ages 25–50. Once you reach retirement and need income, switching to cash dividends makes more sense. Plan your DRIP exit before you need the cash, not after.
The practical implication is that a dividend estimator showing DRIP projections should be your primary planning tool during accumulation. The cash dividend scenario is the right view when you are modeling retirement income needs.
What factors cause dividend income projections to fluctuate?
Dividend income calculations are estimates, not guarantees. Several real-world variables can push actual income above or below what any calculator projects.
- Yield changes with price. Dividend yield is a ratio of annual dividend to current stock price. When the stock price rises, yield falls even if the dividend stays the same. When price drops, yield rises. This means a calculation done in january may look very different by june without any change to the underlying dividend.
- Dividend cuts and suspensions. Companies reduce or eliminate dividends during earnings pressure. A payout ratio above 60–70% signals that a dividend may be unsustainable, even if the calculator projects steady growth. Checking the payout ratio before running projections is a necessary step.
- Tax rate accuracy. Tax drag on dividends, especially in taxable accounts, significantly reduces net income. Modeling with the wrong rate, for example using a 15% qualified rate on REIT income that is taxed as ordinary income, overstates what you will actually receive.
- Inflation erosion. A $600 annual dividend today has less purchasing power in five years if inflation runs at 3% annually. Calculators that model dividend growth rates help offset this, but only if the company actually raises its dividend. Dividend Aristocrats, which are companies with 25 or more consecutive years of dividend increases, offer more reliable growth assumptions.
- Payment schedule changes. Some companies shift from quarterly to annual payments or declare special dividends that inflate one-year projections. Always verify the current payment schedule before entering frequency inputs.
The right approach is to treat calculator outputs as a planning range, not a fixed number. Run a conservative scenario, a base scenario, and an optimistic scenario. The spread between them tells you how much uncertainty you are actually carrying. For tips on monitoring your portfolio regularly alongside these projections, building a review cadence matters as much as the initial calculation.
How to plan your investment income goals with a dividend estimator
Using a dividend estimator for goal planning requires a structured approach. The goal is not just to see what your current holdings produce. The goal is to work backward from a target income and figure out what position size gets you there.
- Set your income target first. Decide how much monthly or annual dividend income you want. A common target for income investors is $2,000 per month, or $24,000 per year.
- Enter your current position. Input shares owned, dividend per share, current price, and payment frequency. This gives you your baseline annual income.
- Calculate the gap. Subtract your current projected income from your target. This is the income gap you need to close through additional investment or dividend growth.
- Model DRIP scenarios. Toggle reinvestment on and off to see how long DRIP takes to close the gap versus adding new capital.
- Apply your actual tax rate. Use your marginal rate for ordinary dividends and the correct qualified rate for eligible dividends. This gives you the after-tax figure that reflects real cash flow.
- Review yield on cost. Yield on cost (YOC) uses your original purchase price rather than the current price to measure how well your dividend strategy has performed over time. A rising YOC means your income is growing relative to what you paid, which is the goal of a long-term dividend strategy.
Pro Tip: Run your dividend projections alongside a broader portfolio review. Knowing your dividend income in isolation is useful. Knowing how it fits within your total asset allocation, including stocks, ETFs, and other holdings, is what drives real financial decisions.
For a deeper look at how calculators fit into broader financial planning, the stock dividend calculator guide on Evibe covers the strategic side in detail.
Key Takeaways
A dividend income calculator is most useful when you treat it as a planning tool with real inputs, not a projection machine running on assumptions.
| Point | Details |
|---|---|
| Core formula | Annual income equals shares owned multiplied by annual dividend per share, adjusted for frequency. |
| DRIP advantage | Reinvesting dividends can produce a 63% higher portfolio value over 20 years versus taking cash. |
| Yield fluctuates daily | Always use the current stock price when calculating dividend yield for accurate results. |
| Tax rate matters | Qualified dividends are taxed at 0%, 15%, or 20%; ordinary dividends are taxed at your income rate. |
| Use yield on cost | YOC measures long-term dividend strategy performance using your original purchase price, not current price. |
Why I think most investors use dividend calculators wrong
Most investors run a dividend calculation once, see a number they like, and move on. That is the wrong way to use these tools.
The calculation is only as good as the inputs you feed it. I have seen investors enter a dividend yield from six months ago, apply a 15% tax rate to REIT income that is actually taxed as ordinary income, and then wonder why their actual cash flow falls short. The math was right. The inputs were wrong.
The payout ratio check is the step most people skip entirely. A company paying out 80% of earnings as dividends looks great in a calculator. It looks very different when earnings drop 20% and the dividend gets cut. Checking the payout ratio before running projections is not optional. It is the filter that separates realistic projections from wishful thinking.
The DRIP versus cash decision also deserves more deliberate thought than it usually gets. Dividend investors tend to switch strategies by life stage: DRIP during accumulation, cash during retirement. The problem is that most people do not plan the transition. They stay in DRIP too long, or they switch to cash too early and miss years of compounding. Mapping that transition to a specific age or portfolio value target makes the decision concrete rather than reactive.
My honest recommendation: recalculate your dividend projections every quarter, update inputs with current prices and declared dividends, and cross-check payout ratios for your top holdings. Treat the calculator as a live instrument, not a one-time estimate.
— Vincent
Evibe's dividend tracker puts your projections into practice
Calculating dividend income on paper is the first step. Tracking it against what actually hits your account is where the real work happens.

Evibe's dividend tracker shows executed, declared, and estimated dividends across your entire portfolio in real time, without manual entry. It syncs directly with your brokerage accounts, so your projections and actual payments stay aligned. Evibe also tracks stocks, ETFs, crypto, and other asset classes in one place, giving you the full picture of your net worth alongside your dividend income. If you want your calculations to reflect what is actually happening in your portfolio, Evibe is built for exactly that. Download it and see how your dividend income fits within your broader financial position.
FAQ
What is the basic formula for dividend income?
Annual dividend income equals the number of shares owned multiplied by the annual dividend per share. For quarterly dividends, multiply the quarterly payment by 4 to get the annual total.
How do you calculate dividend yield?
Dividend yield equals the annual dividend per share divided by the current share price, multiplied by 100. Because stock prices change daily, yield is a dynamic figure that requires current price data for accuracy.
How much dividend will I get from DRIP over time?
Starting with $200,000 at a 3.5% yield and 5% growth, DRIP produces approximately $432,000 after 20 years versus $265,000 from cash dividends. That is a 63% higher portfolio value from reinvestment alone.
What tax rate applies to dividend income?
Qualified dividends are taxed at 0%, 15%, or 20% depending on your income bracket. Ordinary dividends, including most REIT distributions, are taxed at your regular marginal income tax rate.
What is yield on cost and why does it matter?
Yield on cost uses your original purchase price rather than the current price to measure dividend return over time. A rising YOC confirms that your dividend income is growing relative to what you originally invested.