Stock Dividend Calculator: Plan Your Income and Growth
Use our stock dividend calculator to project dividend income and growth — model yield, reinvestment and payout trends to plan retirement and build wealth.
Stock Dividend Calculator: Plan Your Income and Growth

A stock dividend calculator is a financial modeling tool that estimates the income and portfolio growth you can expect from dividend-paying stocks, factoring in variables like dividend yield, reinvestment, taxes, and time horizon. Serious investors use it to move beyond guesswork and build projections grounded in real math. The standard industry term for this practice is dividend income modeling, and a good calculator handles the full picture: yield, compounding through a dividend reinvestment plan (DRIP), tax treatment, and dividend safety. Whether you are planning retirement income or building a supplemental cash flow, understanding how these tools work is the first step toward using them well.
How does a stock dividend calculator work?
The math behind any dividend calculator starts with one formula. Dividend yield is calculated as: (Annual Dividend per Share ÷ Current Stock Price) × 100. A stock priced at $80 paying $3.20 in annual dividends produces a 4% yield. That single number anchors every projection the calculator builds.
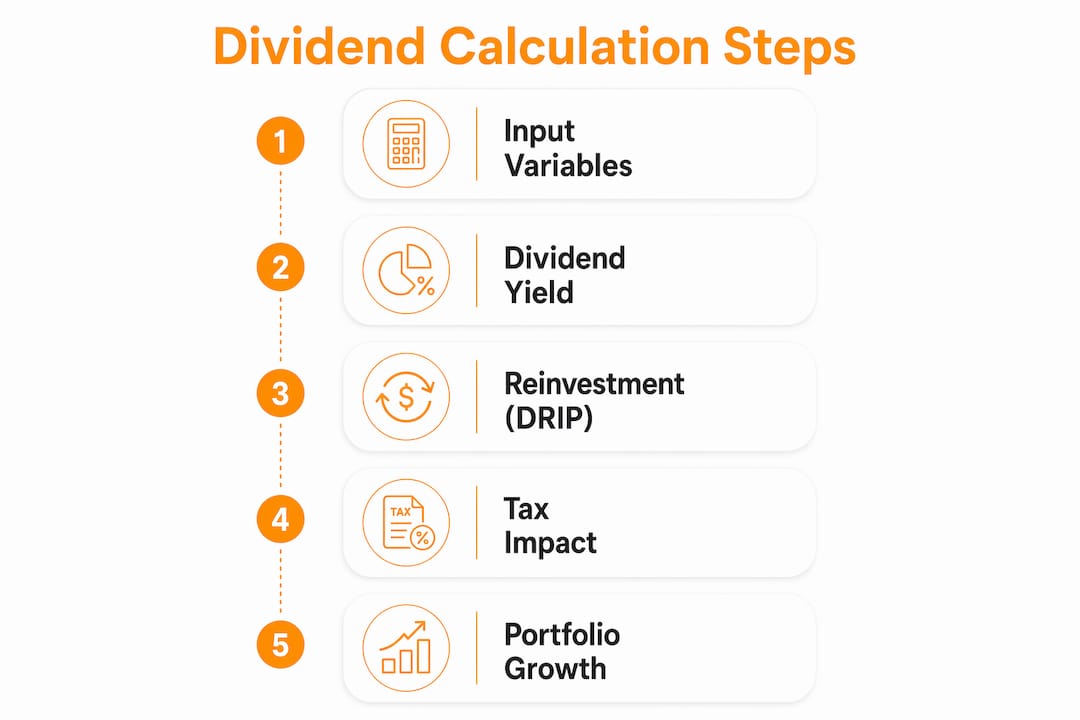
From there, the calculator layers in additional inputs to generate a full income model. The five core variables for projecting future dividend income are:
- Initial investment: The lump sum you start with
- Monthly contributions: Any ongoing additions to your position
- Dividend yield: The annual payout as a percentage of share price
- Dividend growth rate: How fast the company grows its dividend each year
- Time horizon: How many years you plan to hold the investment
Dividend frequency matters more than most investors realize. A stock paying quarterly dividends compounds faster than one paying annually, because each payment arrives sooner and can be reinvested. Monthly dividend payers, common among certain real estate investment trusts and bond funds, compound fastest of all.
DRIP is where the real power shows up. Reinvesting dividends creates a compounding loop: each dividend buys more shares, which generate their own dividends, which buy still more shares. Over 20 years, DRIP adds 25–40% to total wealth compared to taking dividends as cash. That gap widens the longer you hold.

| Input variable | What it models | Why it matters |
|---|---|---|
| Dividend yield | Annual income as % of price | Sets the income baseline |
| Dividend growth rate | Annual payout increases | Projects future income accurately |
| DRIP toggle | Reinvestment vs. cash payout | Shows compounding impact |
| Time horizon | Years of holding | Determines total growth potential |
| Tax rate | After-tax income | Prevents income overestimation |
Pro Tip: Use the S&P 500's average yield of roughly 1.3% as a baseline for broad-market comparisons, and treat yields of 4–8% as the realistic range for dedicated high-yield dividend stocks.
Why taxes and account type change your dividend projections
Tax treatment is the most commonly ignored variable in dividend calculations, and ignoring it produces projections that are simply wrong. Qualified dividends in the U.S. are taxed at 0%, 15%, or 20% depending on your income bracket. Ordinary dividends are taxed as regular income, which can push the effective rate well above 20% for high earners.
Calculators that skip tax modeling can overestimate income by 15–20%. That gap is the difference between a plan that works and one that falls short in retirement.
Account type changes the equation entirely:
- Taxable brokerage account: Dividends are taxed in the year received, reducing cash flow immediately
- Traditional IRA: Dividends grow tax-deferred, but withdrawals are taxed as ordinary income
- Roth IRA: Dividends grow and are withdrawn tax-free, making it the most favorable account for long-term DRIP strategies
Tax modeling in dividend calculators improves accuracy by simulating account-specific treatment. A $500 quarterly dividend in a Roth IRA is worth more than the same payment in a taxable account, because the Roth investor keeps the full amount for reinvestment.
Pro Tip: When modeling dividend income for retirement, run two scenarios side by side: one for a taxable account and one for a Roth IRA. The difference in projected after-tax income over 20 years is often substantial enough to change your account allocation strategy.
What are dividend safety scores and yield traps?
A dividend safety score evaluates whether a company can sustain its current payout. The score draws on payment history, dividend cuts, growth trajectory, and yield sanity checks. Scores above 75 signal a safe dividend. Scores below 55 suggest a real risk of cuts.
Yield traps are the most dangerous pattern in dividend investing. They occur when a stock shows an unusually high yield not because the company is generous, but because the share price has collapsed or the payout is structurally unsustainable. Yields above 12% often indicate unsustainable payouts or structural problems.
Common yield trap warning signs include:
- A yield that has spiked because the share price dropped sharply
- A recent dividend cut combined with a still-elevated yield
- A payout ratio above 100%, meaning the company pays out more than it earns
- Dividends funded by debt or return-of-capital distributions rather than operating earnings
Extraordinary yields are often structural. Synthetic-yield ETFs and return-of-capital distributions can mimic high income while quietly eroding the principal you invested. A calculator that flags these patterns protects you from confusing yield with actual income.
Investors who prioritize dividend safety scores over raw yield consistently avoid the most damaging income traps. A 4% yield from a Dividend Aristocrat, a company with 25 or more consecutive years of dividend growth, is worth far more than a 12% yield from a company with a deteriorating balance sheet.
How to use dividend calculations to plan income and portfolio growth
The most practical use of a dividend calculator is working backward from an income goal. To generate $1,000 per month at a 4% yield, you need $300,000 invested before taxes. Adjust that figure upward based on your tax bracket and account type.
Here is a step-by-step approach to income planning with a dividend calculator:
- Set your income target. Decide how much monthly or annual dividend income you need.
- Choose a realistic yield. Use 3–5% for quality dividend stocks, not the highest yield you can find.
- Apply your tax rate. Divide your gross income target by (1 minus your effective dividend tax rate) to find the pre-tax income needed.
- Calculate required portfolio size. Divide the pre-tax annual income target by your chosen yield.
- Model DRIP growth. Run the projection with dividends reinvested to see how long it takes to reach your target portfolio size organically.
| Income goal (monthly) | Yield assumed | Portfolio required (pre-tax) |
|---|---|---|
| $500 | 4% | $150,000 |
| $1,000 | 4% | $300,000 |
| $2,500 | 4% | $750,000 |
| $5,000 | 4% | $1,500,000 |
Inflation is the variable most investors forget to model. Dividend growth rate and inflation adjustment improve projection accuracy for long-term planning. A 3% annual dividend growth rate roughly keeps pace with historical U.S. inflation, preserving the purchasing power of your income stream over decades. Successful dividend-retirement planning requires modeling inflation impact across 20–30 year horizons.
Pro Tip: Model two growth scenarios: one where the dividend grows at 3% annually (inflation-matching) and one where it stays flat. The gap between those two lines over 25 years will make dividend growth rate one of your top selection criteria.
Key Takeaways
A stock dividend calculator produces accurate income projections only when it accounts for yield, DRIP compounding, tax treatment, dividend safety, and inflation together.
| Point | Details |
|---|---|
| Start with dividend yield | Use (Annual Dividend ÷ Stock Price) × 100 as the foundation for all projections. |
| DRIP compounds wealth significantly | Reinvesting dividends over 20 years adds 25–40% more wealth than taking cash payouts. |
| Tax modeling prevents overestimation | Calculators without tax settings can overstate income by 15–20%. |
| Safety scores beat raw yield | Scores above 75 indicate a sustainable payout; yields above 12% often signal a yield trap. |
| Inflation adjustment is non-negotiable | A dividend growth rate of at least 3% annually is needed to maintain purchasing power over time. |
What most dividend calculators get wrong
Most dividend calculators assume static dividend rates and share prices. That assumption is unrealistic, and it leads to projections that either overstate or understate your actual outcome. Basic calculators ignore growth rates and price changes, which are the two variables that matter most over a 10-plus year horizon.
My bigger concern is how investors use these tools. I have seen people run a calculation, see a large number at year 20, and treat it as a plan. It is not a plan. It is a scenario. The difference matters enormously.
The number one mistake I observe is selecting a stock based on yield alone, plugging it into a calculator, and projecting that yield forward for 20 years without checking whether the company can actually sustain the payout. A safety score check takes 60 seconds and eliminates the most dangerous positions before they cost you real money.
Dividend income should be considered alongside total return, including capital appreciation, for a full picture of investment performance. A stock that pays a 5% yield but loses 3% of its value annually is underperforming a stock that pays 2% and grows 8% per year. The calculator only shows you one side of that equation unless you build in share price assumptions.
My practical advice: use the calculator to set a target portfolio size, then use a dividend tracker to monitor whether your actual holdings are delivering on the assumptions you modeled. The two tools work together. Neither one alone is sufficient.
— Vicnent
Evibe makes dividend tracking and income planning clearer
Calculating dividend income on paper is one thing. Watching it arrive, compound, and grow in real time is another. Evibe's dividend tracker consolidates executed, declared, and estimated dividend payments across your entire portfolio, so you always know what is coming and when.

Evibe syncs automatically with your brokerage accounts, eliminating manual entry and keeping your projections grounded in live data. The AI-driven analysis flags portfolio risk and diversification gaps, so your dividend strategy fits within your broader financial picture. For investors who want to move from spreadsheet estimates to real-time income monitoring, Evibe's portfolio tracker is where the calculation becomes a living plan.
FAQ
What is a stock dividend calculator?
A stock dividend calculator is a tool that estimates future dividend income and portfolio growth by modeling inputs like investment amount, dividend yield, reinvestment settings, and time horizon. It helps investors project both cash income and compounding effects from DRIP.
How do I calculate dividend yield?
Dividend yield equals annual dividend per share divided by current stock price, multiplied by 100. A stock at $80 paying $3.20 annually has a 4% yield.
What is a yield trap and how do I avoid it?
A yield trap occurs when an unusually high yield, often above 12%, signals an unsustainable payout rather than genuine income strength. Check the dividend safety score and payout ratio before investing in any high-yield stock.
How much do I need to invest to live off dividends?
To generate $1,000 per month at a 4% yield, you need approximately $300,000 invested before taxes. Adjust upward based on your tax bracket and the account type you use.
Does dividend reinvestment really make a significant difference?
Yes. Reinvesting dividends through a DRIP adds 25–40% more wealth over 20 years compared to taking dividends as cash. The compounding effect accelerates as your share count grows.