ETF Overlap Analysis: Identify Duplication in Your Portfolio
Discover how to analyze ETF overlap in your portfolio. Minimize redundancy, enhance diversification, and optimize holdings with our quick reference guide.
ETF Overlap Analysis: Identify Duplication in Your Portfolio

Share-weighted holdings overlap is the practical standard for measuring ETF overlap. If two funds share a high level of weighted exposure, you are effectively paying two expense ratios for one position. A moderate range signals redundancy worth reviewing, and lower overlap generally means the funds complement each other.
The weight-overlap formula is straightforward:
Weight Overlap = Σ min(weightA_i, weightB_i) across all securities held in both funds.
To compute it, you need three things:
- Full holdings lists for each ETF (ticker or CUSIP, weight as a percentage of NAV)
- A canonical identifier to match the same security across both lists
- A simple sum of the smaller weight for each matched pair
Overlap thresholds at a glance: Below 40% = complementary. 40–70% = moderate, review sector and factor bets. Above 70% = high redundancy, consider consolidation.
Key Takeaways
| Point | Details |
|---|---|
| Use weight overlap, not count | Sum of min(weightA, weightB) across matched securities is the practical standard. |
| Know your thresholds | Above 70% = high redundancy; 40–70% = review sector/factor bets; below 40% = likely complementary. |
| Match on CUSIP, not ticker | Ticker mismatches inflate apparent diversification; CUSIP or SEDOL matching is more reliable. |
| Check data freshness | Issuer holdings pages update daily or weekly; SEC N-PORT filings lag by up to 60 days. |
| Monitor continuously with Evibe | Evibe's ETF analytics sync holdings automatically and alert you when overlap crosses your set threshold. |
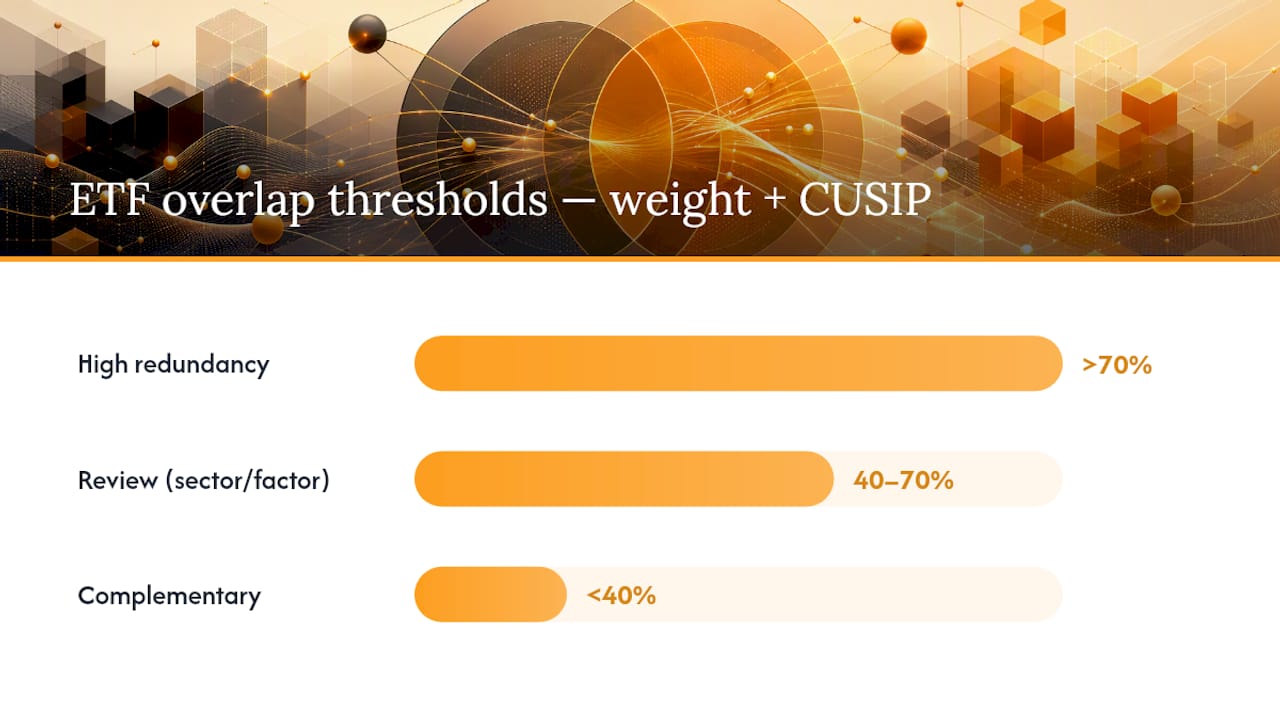
Table of Contents
- What ETF overlap means for your diversification
- How ETF overlap is calculated: formulas and a worked example
- Two practical workflows to check overlap fast
- How to interpret your overlap results and what to do next
- Where overlap data comes from and which tool types to use
- How Evibe integrates continuous ETF-overlap monitoring
- Advanced pitfalls that can mislead overlap numbers
- The case for running overlap checks more often than you think
- Continuous ETF-overlap monitoring, built into your portfolio tracker
- Sources
What ETF overlap means for your diversification
Two ETFs can carry completely different names, track different indexes, and still expose you to the same 30 stocks at nearly identical weights. That is the core problem ETF overlap analysis is designed to catch.
Count overlap measures how many securities appear in both funds as a fraction of total unique positions. Weight overlap measures how much of your capital is doing the same work twice.
Why does this matter beyond the obvious?
- Diversification illusion. Holding three large-cap blend ETFs feels diversified. If they share 75% weighted exposure, your effective number of independent bets is far smaller than the position count suggests.
- Duplicate fees. You pay each fund's expense ratio on the overlapping portion. That cost compounds silently over years.
- Unintended factor concentration. Two funds with different stated mandates can still load heavily on the same factors, such as momentum or low volatility, amplifying drawdowns when that factor reverses.
- Rebalancing friction. When you trim one fund and add another to "diversify," high overlap means you have changed almost nothing, yet triggered a taxable event.
A concrete example: a broad U.S. total market ETF and a large-cap growth ETF may both hold Apple, Microsoft, Nvidia, Amazon, and Meta as their top five positions. Those five names alone can represent a significant portion of both funds' NAV. An investor holding both in equal weight has not split their large-cap tech exposure. They have doubled it.
How ETF overlap is calculated: formulas and a worked example
The two formulas serve different purposes. Use weight overlap as your primary metric and count overlap as a secondary sanity check.
Weight overlap formula:
Weight Overlap (%) = Σ min(weightA_i, weightB_i) × 100
where the sum runs over every security i that appears in both Fund A and Fund B.
Count overlap formula:
Count Overlap (%) = (Shared positions) / (Total unique positions across both funds) × 100
Overlap calculators apply exactly this logic, comparing holdings line by line and reporting both metrics simultaneously.
Why canonical matching matters
Before you sum anything, every security must map to the same identifier in both lists. Issuers use different ticker conventions, especially for foreign-listed shares, ADRs, and share classes. CUSIP or SEDOL matching is more reliable than ticker matching. A mismatch here inflates apparent diversification because the same company appears as two separate positions.
Worked example: Five holdings, two funds (weights as % of NAV)
Large comparisons across two large-cap blend funds can routinely produce weight overlap at moderately high levels.
Pro Tip: Always timestamp your holdings data. SEC N-PORT filings are published quarterly with a 60-day lag, so a filing dated March 31 may not appear on EDGAR until late May. Issuer holdings pages update daily or weekly and are usually fresher. Note the date of each source when you record results.
Two practical workflows to check overlap fast
Workflow A: overlap calculator (5–10 minutes)
- Open an ETF overlap tool or a portfolio analytics platform that supports ETF comparison.
- Enter the tickers for Fund A and Fund B. Some tools support up to 10 ETFs simultaneously and display a pairwise overlap matrix, which is useful when auditing a whole portfolio at once.
- Review weight overlap first, then count overlap. Note the top five shared holdings and their combined weight.
- Export or screenshot the results with the data-as-of date visible.
- Repeat for every fund pair in your portfolio.
Total time: roughly 5–10 minutes per pair for a tool-based check.
Workflow B: spreadsheet method (30–60 minutes)
- Download the full holdings CSV for each ETF from the issuer's website or pull the most recent SEC N-PORT filing from EDGAR.
- Normalize identifiers: add a CUSIP or SEDOL column if tickers differ across lists. A VLOOKUP or INDEX/MATCH on CUSIP is more reliable than matching on ticker strings.
- Combine both lists into one sheet. Flag rows where the same CUSIP appears in both funds.
- For matched rows, add a column:
=MIN(weightA, weightB). - Sum that column. The result is your weight overlap percentage.
- For count overlap: count matched CUSIPs divided by total unique CUSIPs across both lists.
Sample Excel formula for weight overlap in a merged sheet where column C holds Fund A weights and column D holds Fund B weights, with column E flagging matched securities:
=SUMPRODUCT((E2:E500="match")*MIN(C2:C500,D2:D500))
Pro Tip: When tickers differ for the same underlying (e.g., a U.S.-listed ADR vs. the foreign-listed share), search the issuer's CUSIP against a free reference like EDGAR's full-text search before assuming they are different securities. One missed match can understate overlap by several percentage points.
Time benchmark: A two-fund spreadsheet check takes 30–60 minutes the first time. Once your template is built, subsequent checks run in under 15 minutes.
How to interpret your overlap results and what to do next
Numbers alone do not tell you what to do. Context determines the right response.
You are paying two expense ratios for nearly identical exposure. The practical options are consolidating into the lower-cost fund, replacing one with a fund that targets a genuinely different segment (small-cap, international, sector-specific), or accepting the overlap deliberately if one fund serves a specific purpose such as tax-loss harvesting with a similar but not identical index.
Before acting, check whether the overlap is concentrated in a single sector or factor. Review the non-overlapping portion: if it targets a segment you actually want exposure to, the redundancy may be acceptable.
Still worth confirming that the non-overlapping portions are not loading on the same factor (both value-tilted, both momentum-tilted) even if the names differ.
Pro Tip: Before selling a fund to eliminate overlap, model the tax impact. In a taxable account, a large embedded gain can make consolidation expensive in the short term even when the long-term case is clear. A tool that tracks your cost basis and dividend history alongside overlap data makes this tradeoff visible in one place.
Action steps regardless of overlap level:
- Cross-check sector weights, not just security names. Two funds with 35% name overlap can have nearly identical sector allocations.
- Compare expense ratios on the overlapping portion. If Fund A costs 0.03% and Fund B costs 0.20%, and they share 65% of their exposure, you are overpaying on that 65% slice.
- Check whether the timing is right before replacing a fund mid-cycle. Selling into a drawdown to rebalance can lock in losses unnecessarily.
- Document your decision. If you accept redundancy deliberately, record the reason so a future audit does not flag it as an oversight.
Where overlap data comes from and which tool types to use
The quality of your overlap analysis is only as good as your holdings data. Three primary sources exist, each with trade-offs.
Issuer holdings pages are the most current. BlackRock (iShares), Vanguard, State Street (SPDR), and Invesco publish daily or weekly holdings CSVs directly on their fund pages. These are the preferred source for any overlap check because they reflect the fund's actual current composition, not a lagged snapshot.
SEC EDGAR filings (N-PORT and N-CSR) are the authoritative public record. N-PORT filings are submitted monthly but released to the public quarterly, typically with a 60-day lag. N-CSR filings accompany annual and semi-annual reports. Both are useful for verifying holdings and for funds whose issuers do not publish daily CSVs. Some overlap tools source their data directly from EDGAR and update on a published cadence.
Fund fact sheets are the least granular. They typically show only the top 10 holdings and are unsuitable for a full weight-overlap calculation.
Tool categories
Free online overlap calculators handle the matching and arithmetic automatically. They are fast and sufficient for a two-fund spot check. The main limitation is that they rely on their own data pipeline, which may lag issuer disclosures by days or weeks. Tools that support multi-ETF matrix comparisons across up to 10 funds at once are particularly useful when auditing a full portfolio.
Portfolio analytics platforms (including ETF-specific analytics tools) go further: they sync holdings automatically, run overlap calculations continuously, and alert you when overlap crosses a threshold. The trade-off is cost and setup time.
Spreadsheet workflows give you full control over the data and methodology. They are slower but let you verify every step and apply custom identifier matching.
Accuracy caveats to keep in mind:
- Synthetic ETFs (swap-based) may show zero name overlap with a physical fund while replicating nearly identical index exposure. Name overlap understates true economic overlap in this case.
- Funds that use futures or options to gain exposure will not show those positions as equity holdings, so a standard overlap check misses the underlying economic bet.
- Rounding in published weights (often to two decimal places) introduces small errors in the sum. For large funds, this is negligible. For concentrated funds with fewer than 50 holdings, it can shift the result by 1–2 percentage points.
- Issuer naming conventions for the same security can differ. Always verify CUSIP or SEDOL before concluding two tickers represent different companies. Live ETF data feeds, such as those available at Handy, can help cross-reference holdings and identifiers in real time.
How Evibe integrates continuous ETF-overlap monitoring
Running a one-time overlap check is useful. Running it continuously, across your entire portfolio, every time holdings update, is what actually protects diversification over time.
Evibe's ETF portfolio tracker is built for exactly this. Key capabilities relevant to overlap monitoring:
- Automatic holdings import from connected brokerage accounts, so your ETF positions are always current without manual CSV uploads.
- ETF-specific analytics covering weight overlap, count overlap, and top shared holdings across every fund pair in your portfolio.
- Smart alerts that notify you when overlap between two funds crosses a threshold you set, triggered by holdings updates rather than a fixed calendar.
- Multi-ETF comparison across your whole portfolio, not just two funds at a time, so you can see the full overlap matrix in one view.
- AI-driven analysis that surfaces concentration risk and diversification gaps alongside the raw overlap numbers.
For a new user, the suggested first steps are: sync your brokerage accounts, let Evibe pull your current ETF positions, and run the initial overlap report. The report shows your highest-overlap pairs immediately, ranked by weight overlap. From there, the alert settings let you define the threshold at which you want to be notified.
Evibe replaces the quarterly manual spreadsheet check with continuous monitoring. For investors who add funds periodically or rebalance across multiple accounts, that shift from periodic to continuous is the practical difference between catching a redundancy early and discovering it a year later.
Advanced pitfalls that can mislead overlap numbers
Standard overlap calculations assume that what a fund reports as its holdings is what it actually owns. Several situations break that assumption.
Funds-of-funds and look-through holdings. A fund that holds other ETFs as its positions will show those ETFs as line items, not the underlying stocks. A naive overlap check between a fund-of-funds and a direct-equity ETF will show near-zero name overlap even when the underlying exposure is nearly identical. The fix is look-through analysis: replace each ETF holding with its pro-rata underlying positions before running the overlap formula.

Synthetic and swap-based ETFs. These funds hold a basket of collateral (often unrelated to the index) and receive index returns via a total-return swap with a counterparty. Name overlap between a synthetic ETF and a physical ETF tracking the same index will be low or zero, yet their economic exposure is nearly identical. Counterparty concentration adds a second layer of risk that name overlap cannot capture. For options-based or structured ETFs, Evibe's options tracking features can help surface derivative exposures that standard holdings lists omit.
**Factor and sector overlap vs. In a value drawdown, both funds will fall together regardless of their low name overlap. Testing for factor overlap requires running a factor regression (Fama-French three-factor or five-factor model) on each fund's returns, not just comparing holdings lists.
Pro Tip: For international ETFs, check ADR overlap carefully. A U.S.-listed ADR and the foreign-listed ordinary share of the same company will appear as different tickers and different CUSIPs in most holdings lists, but they represent the same economic exposure. Large international ETFs and global ETFs frequently hold both forms of the same issuer, which understates true concentration.
Small-cap ETFs with large-cap drift. Some small-cap ETFs hold a long tail of micro-cap names but concentrate their top weights in companies near the large-cap boundary. If a large-cap ETF also holds those boundary names, the weight overlap between the two funds can be surprisingly high despite their different stated mandates. Always check the top-decile holdings by weight, not just the average across all positions.
The case for running overlap checks more often than you think
Most investors run an overlap check once, when they first build a portfolio, and then forget about it. That cadence is too slow.
ETF holdings drift. Index reconstitutions, corporate actions, and manager discretion all shift what a fund actually owns quarter to quarter. The overlap you measured at purchase is not the overlap you have today.
My recommended cadence: run a full portfolio overlap audit quarterly, and run a targeted check any time you add a new ETF, rebalance, or see a major market move that reshuffles index weights. The quarterly audit catches slow drift. The event-triggered check catches the obvious cases before they compound.
Alerts are the practical shortcut. The tool checks for you and surfaces the pair that crossed the line. That is the difference between a monitoring system and a to-do list.
One thing worth saying plainly: the goal is not zero overlap. Some overlap between a core holding and a satellite position is expected and fine. The goal is intentional overlap, where you know what you own, why you own it, and what the redundancy costs you in fees and concentration risk. Overlap analysis is the tool that keeps that knowledge current.
Continuous ETF-overlap monitoring, built into your portfolio tracker
Running a manual overlap check every quarter is better than nothing. Running it automatically, across every fund pair, every time holdings update, is what actually keeps your diversification intact.

Evibe does the continuous work for you. Sync your brokerage accounts once, and Evibe pulls your ETF positions automatically, runs weight and count overlap across your full portfolio, and alerts you when any pair crosses your threshold. No spreadsheets, no manual CSV downloads, no quarterly reminders to yourself.
The 7 days of Premium every new account gets give you enough time to sync your accounts, run your first overlap report, and see exactly which fund pairs are working against your diversification. Get started free at Evibe and run your first overlap audit today.
Sources
The sources below are the primary references for verifying ETF holdings, understanding overlap methodology, and staying current on industry practice.
- Form ADV filing (SEC AdviserInfo) — example adviser disclosure
This article is general information, not a substitute for advice from a qualified financial advisor. Consult a qualified financial professional about your own circumstances before acting on anything here.