ETF Analysis Tools for Whole-Portfolio Investors
Discover effective ETF analysis tools to optimize your whole portfolio. Evaluate risk, diversification, and performance in one private, Apple-native dashboard.
ETF Analysis Tools for Whole-Portfolio Investors

TL;DR:
- Using a single integrated tracker helps evaluate ETFs within the context of your entire portfolio, revealing duplication risks. Tools offering deep metrics and real-time data enable better risk management and more accurate diversification assessments. Evibe consolidates these features, providing automatic account sync, overlap visualization, and AI-driven insights for comprehensive ETF analysis.
The fastest way to evaluate an ETF inside your total portfolio is to use a single integrated tracker that combines ETF-level analytics with whole-portfolio rollups. Checking expense ratio, Sharpe ratio, and holdings overlap in isolation tells you almost nothing — what matters is how those numbers interact with everything else you own. Fund composition is the most immediate portfolio-dependent factor: buying a second S&P 500 ETF when your 401(k) already holds one creates redundant exposure, not diversification. Evibe is our recommended integrated option. It syncs brokerage accounts automatically, tracks ETFs alongside every other asset class, and applies AI-driven analytics to surface risk, diversification gaps, and performance metrics in one dashboard.
The core signal: an ETF that looks attractive in isolation can quietly duplicate exposure you already hold, inflating concentration risk without adding any real diversification.
Table of Contents
- What should ETF analysis tools actually do?
- How do you pick the right ETF analysis tool for your portfolio?
- A six-step workflow to evaluate any ETF against your whole portfolio
- How Evibe meets the ETF analysis checklist
- Why an integrated app beats a patchwork of separate ETF tools
- Key Takeaways
- The case for seeing the whole picture
- Get started with Evibe today
- Authoritative sources for deeper research
What should ETF analysis tools actually do?
Professional-grade ETF analysis goes well beyond a ticker lookup. The tools that genuinely serve portfolio investors cover all of the following:
- Screening and filtering: filter many ETFs by asset class, expense ratio, AUM, liquidity (trading volume), ESG score, and fund flows. ETF screeners return sortable tables with key metrics side by side.
- Side-by-side performance comparison: Sharpe ratio, Sortino ratio, max drawdown, Ulcer Index, beta, and tracking error. Rolling-window versions of these metrics give a more stable picture than single-period figures.
- Holdings-level analysis: merged holdings across all your accounts, weighted sector and geographic rollups, top-10 concentration, and overlap percentage between ETFs you already own.
- Portfolio-level analytics: aggregated allocations, weighted expense ratio across your whole book, and correlation matrices between ETFs and other asset classes.
- Backtesting and scenario testing: rebalancing simulations, dollar-cost averaging scenarios, and stress tests. The CFA Institute advises using backtests to validate a rebalancing process rather than to identify a single historically best-performing fund.
- Data and integrations: automatic brokerage and bank account sync, real-time pricing, and correct handling of corporate actions and dividends.
- Output and reporting: exportable transactions, tax reports, CSV/Excel downloads, and API access for automation or integration with AI assistants.
Proprietary fundamental data — earnings growth, estimate revisions, valuation metrics — rounds out the picture for investors who need more than fees and past returns.
How do you pick the right ETF analysis tool for your portfolio?
Run every candidate tool through this checklist before committing.
| Axis | What to verify | Red flag |
|---|---|---|
| Portfolio integration | Automatic sync with your brokerages; CSV import fallback | Manual-only data entry for brokerage accounts |
| ETF analytics depth | Sharpe, Sortino, tracking error, overlap %; holdings merge | No overlap tool; only headline returns shown |
| Data freshness | Real-time pricing; holdings updated after each broker sync | Opaque data sources; no stated refresh cadence |
| Security and privacy | Encryption at rest and in transit; clear data policy | No stated encryption; data resold to third parties |
| Platform availability | iPhone, Mac, and/or web access | Mobile-only with no desktop view |
| Cost and pricing | Transparent subscription tiers; trial or demo available | No trial; annual lock-in with no refund policy |
| Export and API | CSV/Excel export; API endpoints for automation | No export; no API access |
"Investors cannot fully evaluate the underlying assets of an ETF without understanding their roles in their portfolio." — Investopedia
When you talk to a vendor, ask specifically: which brokerages does your sync cover, how often do holdings update after a sync, and what export formats are available on the base tier? If those answers are vague, treat it as a signal about the product's maturity. For a broader look at how portfolio management tools differ in integration depth, the comparison is worth reviewing before you decide.
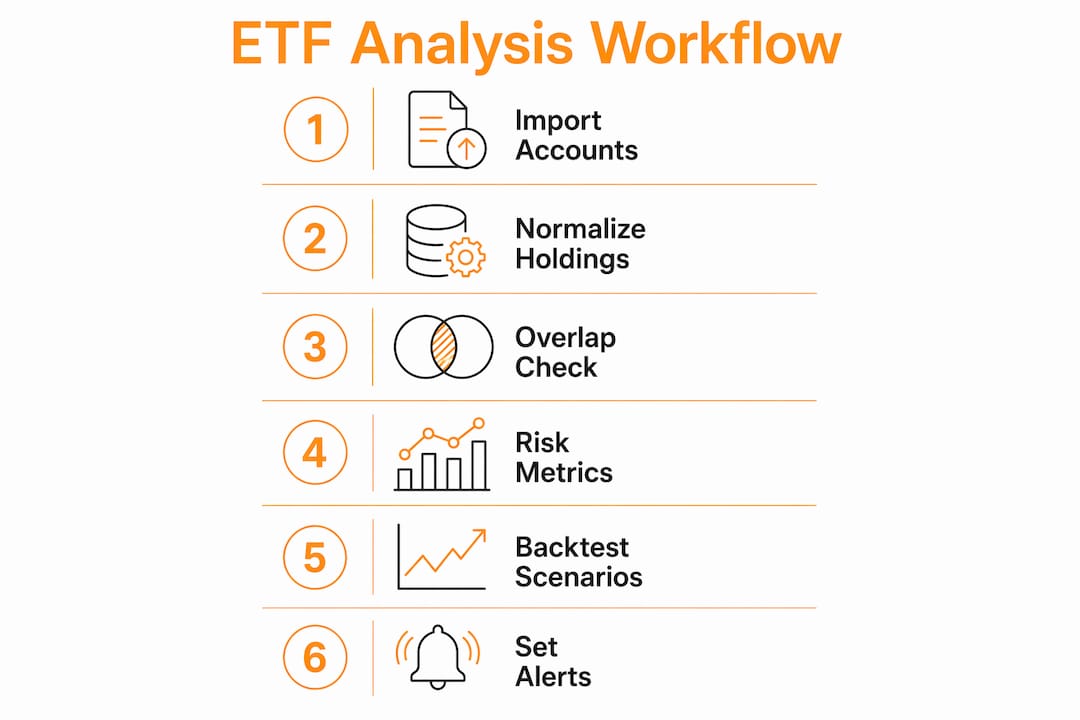
A six-step workflow to evaluate any ETF against your whole portfolio
Step 1 — Import and aggregate accounts. Connect all brokerage and bank accounts via automatic sync, or upload CSV statements. The goal is real position weights, not estimates.

Step 2 — Normalize holdings. Confirm tickers are mapped correctly, currencies are converted at current FX rates, and corporate actions (splits, mergers) are reflected. A tool that handles this automatically saves hours of reconciliation.
Step 3 — Run a holdings overlap and concentration check. Overlap visualization shows the percentage of shared holdings between the ETF you're evaluating and what you already own. Two S&P 500 ETFs can produce near-total overlap, turning a perceived diversification move into pure concentration. Check top-10 concentration as well.
Step 4 — Calculate risk-adjusted metrics and correlation. Pull Sharpe, Sortino, beta, and tracking error for the candidate ETF. Then check its correlation with existing holdings — a low-correlation addition genuinely reduces portfolio volatility; a high-correlation one mostly adds cost.
Step 5 — Backtest allocation scenarios. Model what happens if you add the ETF at your target weight, with your rebalancing rules applied. Test a stress scenario (2020 drawdown, 2022 rate shock). The point is to validate your rebalancing process, not to find the fund with the best historical backtest.
Step 6 — Finalize and set alerts. Once you decide, set price and allocation-drift alerts so the position stays within your target band without constant manual checking.
Pro Tip: Use backtesting to confirm that your rebalancing rules hold up across different market regimes. Chasing the fund with the best historical Sharpe ratio is a form of overfitting — the CFA Institute flags this as one of the most common backtesting errors.
How Evibe meets the ETF analysis checklist
Evibe consolidates stocks, ETFs, options, crypto, real estate, and more into a single dashboard. For ETF investors specifically, the ETF portfolio tracker handles automatic account sync from 1,000+ banks, brokerages and crypto exchanges across the US, Canada and Europe, real-time global market data, and holdings rollups that merge positions across all connected accounts.
Holdings overlap visualization surfaces weighted duplicate exposures — exactly the institutional-grade portfolio x-ray capability that basic aggregators miss. Risk metrics including Sharpe ratio and max drawdown are available alongside AI-driven insights that flag diversification gaps and concentration risks in plain language.
| Feature | Evibe capability |
|---|---|
| Account sync | Automatic; 1,000+ banks, brokerages and crypto exchanges across the US, Canada and Europe |
| ETF analytics | Overlap %, sector/geography rollups, weighted expense ratio |
| Risk metrics | Sharpe ratio, max drawdown, AI-driven risk flags |
| Dividend tracking | Executed, declared, and estimated dividends with yield on cost |
| Options tracking | Greeks and expiry calendars alongside ETF positions |
| Multi-currency | Historical FX rates; global market data |
| Platform | iPhone, Mac; Apple App Store subscription |
| Security | Encryption at rest and in transit; no data selling; no ads |
| API | Endpoints for ChatGPT, Claude, and Gemini integration |
| Trial path | Free to use via the App Store; verify sync coverage and overlap report during your 7 days of Premium |
Premium is managed entirely through the Apple App Store — no separate billing portal, no data monetization. During your 7 days of Premium, the first things to verify are brokerage sync coverage, that the holdings rollup reflects your actual positions, and that the overlap report runs correctly against your existing ETFs.
Why an integrated app beats a patchwork of separate ETF tools
Piecing together a standalone screener, a separate backtesting tool, and a spreadsheet for holdings tracking creates three distinct failure points. Data timestamps rarely align across tools, so the "current" allocation you're analyzing may already be stale. Correlations between asset classes get missed entirely when ETFs live in one tool and real estate or crypto live in another.
| Approach | Strengths | Practical cost |
|---|---|---|
| Integrated portfolio app | Single source of truth; automated overlap detection; cross-asset correlation; unified alerts | Subscription fee; dependent on sync coverage |
| Standalone ETF screener | Deep screening filters; free tiers available | No portfolio context; manual reconciliation required |
| Spreadsheet | Full customization | Manual data entry; no real-time pricing; error-prone |
| Hybrid (screener + integrated tracker) | Best of both for deep research | Two tools to maintain; data must be reconciled |
The hybrid approach makes sense when you need specialized fundamental screening — earnings estimate revisions, valuation signals — that a portfolio tracker doesn't surface. Use the screener for initial fund discovery, then bring the candidate into your integrated tracker for the overlap and risk checks that actually determine fit. For a detailed look at holdings overlap alternatives, the comparison covers what to expect from each approach.
Key Takeaways
Fund composition and holdings overlap are the most portfolio-dependent factors when evaluating an ETF — a tool that shows only headline returns without merging your actual holdings will consistently lead you to the wrong conclusion.
| Point | Details |
|---|---|
| Integration beats isolation | Evaluate ETFs inside your whole portfolio, not as standalone tickers, to catch duplicate exposure. |
| Overlap check first | Run a holdings overlap report before any other metric — two similar ETFs can create near-total redundancy. |
| Backtest the process, not the fund | Use backtesting to validate rebalancing rules across market regimes, not to chase historical winners. |
| Verify data freshness | During any trial, confirm that holdings update after each broker sync and that pricing is real-time. |
| Evibe as integrated tracker | Evibe combines automatic account sync, ETF overlap visualization, and AI-driven risk metrics in one app. |
The case for seeing the whole picture
Most investors I talk with underestimate how much duplicate exposure accumulates quietly over time. You add a tech-sector ETF, then a growth ETF, then a large-cap blend — and by the time you check, the top 10 holdings across all three are nearly identical. The headline diversification looks fine; the actual concentration is not.
The conventional wisdom says to pick good ETFs. The more useful discipline is to check what you already own before you buy anything. Holdings overlap is concrete and calculable — it's not a soft risk, it's a percentage. Tools that surface that number automatically, inside the context of your full portfolio, change the quality of the decision.
That's the reason we built Evibe the way we did. The AI-driven insights aren't there to replace your judgment; they're there to surface the numbers you'd otherwise have to calculate manually across three different tools. Test it with a real import and run the overlap report. The picture is usually more concentrated than investors expect.
Get started with Evibe today
Evibe gives you ETF overlap detection, AI-driven risk analysis, and automatic account sync across all your asset classes — in one app, without the manual reconciliation that comes with patching tools together.

The onboarding takes three steps: connect your brokerage accounts via automatic sync, review the holdings rollup to confirm your real position weights, and run the overlap report against your existing ETFs. That first overlap check alone tends to surface concentration risks most investors didn't know they had.
Security is handled through encryption at rest and in transit. Evibe does not sell your data and carries no ads — the product is the subscription. Get started free through the App Store and verify sync coverage and the overlap report during your 7 days of Premium before committing.
Authoritative sources for deeper research
| Source | What to use it for |
|---|---|
| Investopedia — How to Evaluate ETF Performance | Foundational framework: expense ratio, fund composition, tracking efficiency, and liquidity explained clearly |
| ETF Database Screener | Filter many ETFs by asset class, expense ratio, AUM, dividends, holdings concentration, and technicals |
| ETF.com Screener and Tools | Fund flows, ETF pulse, portfolio builder, and stock-holdings lookup for initial fund discovery |
| CFA Institute | Best-practice guidance on backtesting methodology and avoiding overfitting in process validation |
| VizETF | Rolling risk metrics (Sharpe, Sortino, max drawdown, Ulcer Index) computed with daily price data |
| Carson Group — Overlap Tools | Practical explanation of holdings overlap calculation and weighted duplicate exposure |
| TradeAiFi — AI Trading Platform | AI-driven signal feeds for investors who want specialized quant signals alongside portfolio tracking |
Use these sources during your first days with Evibe to cross-validate metrics. If a risk figure in Evibe differs from what a standalone tool shows, check the rolling window used — a 1-year rolling Sharpe and a since-inception Sharpe will rarely match, and neither is wrong.