ETF Dividend Calculator: Your 2026 Income Planning Guide
ETF dividend calculator: plan your 2026 income accurately with fund-specific insights on yield, growth, and reinvestment for smarter investing.
ETF Dividend Calculator: Your 2026 Income Planning Guide

TL;DR:
- An ETF dividend calculator estimates income by factoring in investment amount, yield, payout frequency, and expenses. Accurate projections rely on correct inputs, especially dividend yield and payout cycles, to avoid costly errors. Investors should analyze dividend safety, account for DRIP benefits, and incorporate expense ratios for reliable long-term income planning.
An ETF dividend calculator is defined as a financial tool that estimates dividend income from exchange-traded funds by combining investment amount, dividend yield, payout frequency, reinvestment options, and expense ratios into a single projection. Unlike a basic compound interest calculator, a dividend-focused tool accounts for fund-specific variables that directly affect your actual cash flows. For income investors holding funds like SCHD, VOO, SPHD, or high-yield monthly payers, the difference between a rough estimate and an accurate projection can mean thousands of dollars in planning errors. This guide covers what these calculators require, where they mislead, and how to use them to build a reliable income plan in 2026.
What does an ETF dividend calculator actually require?
ETF dividend calculators require a specific set of inputs to produce useful projections. The accuracy of your output depends entirely on the quality of what you enter. Getting one variable wrong, especially dividend yield or expense ratio, can distort your projected income by a wide margin.
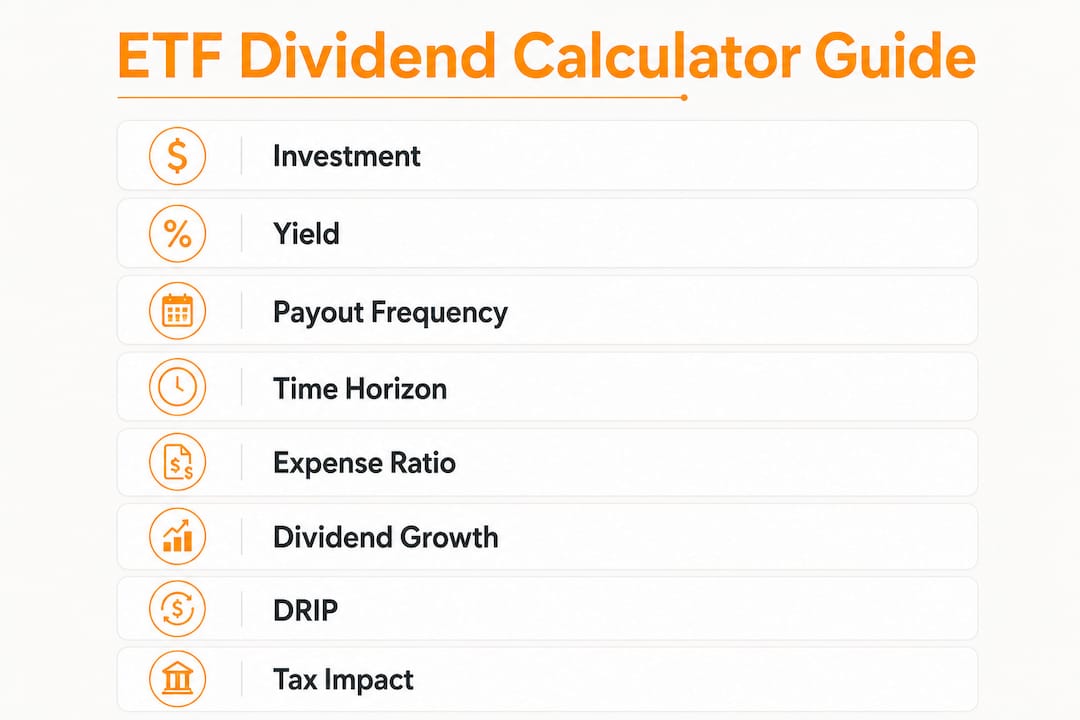
The core inputs every dividend calculator needs are:
- Investment amount: The total dollars you are putting to work in the ETF.
- Dividend yield: The annual distribution rate expressed as a percentage of share price.
- Payout frequency: Whether the fund pays monthly, quarterly, or annually. Monthly payers like SPHD behave very differently from quarterly payers like VOO in compounding models.
- Time horizon: How many years you plan to hold the position.
Advanced calculators add inputs that change projections significantly: expected annual dividend growth rate, expense ratio, reinvestment choice (DRIP or cash), and account type for tax modeling. Each of these variables compounds over time. A fund with a 0.06% expense ratio, like VOO, costs far less over 20 years than a covered-call ETF charging 0.65%, and that gap shows up clearly in a well-built model.
The payout frequency input is one investors most often underestimate. A fund paying monthly dividends gives you 12 reinvestment cycles per year instead of four. Over a decade, that difference in compounding frequency adds up to a meaningful gap in total portfolio value.

Pro Tip: Always source your dividend yield from a trailing 12-month figure, not the most recent single distribution annualized. Single-quarter yields can spike or drop due to special dividends, giving you a distorted baseline.
How do you identify and avoid dividend yield traps?
A yield trap is an ETF that advertises an unsustainably high distribution rate, often funded by returning investors' own capital rather than earnings. Yields over 12% frequently signal covered-call structures or return-of-capital distributions that erode your cost basis over time. That erosion is the trap: you receive income while your principal quietly shrinks.
NAV decay is the mechanism behind most yield traps. A fund can pay out $1.00 per share monthly while its net asset value drops $1.20 per share. The math is straightforward: you are losing $0.20 per share per month in real wealth while feeling like you are earning income. High-yield ETFs built on covered calls or derivatives are the most common offenders, and their NAV charts tell the story that their yield figures hide.
The warning signs of a yield trap include:
- Yields that consistently exceed 12% without a corresponding earnings base.
- Monthly payout structures funded partly or entirely by return of capital.
- NAV charts trending downward over 12–36 months despite steady distributions.
- Covered-call or derivative-heavy fund structures where income is synthetic.
Dividend safety is best measured by historical payout consistency and growth, not by the current yield rate alone. A fund like SCHD, which has grown its dividend for multiple consecutive years, presents a fundamentally different risk profile than a fund yielding 15% for 18 months before cutting.
Advanced calculators address this by modeling both the dividend stream and NAV trajectory simultaneously. When you run a SCHD dividend calculator projection alongside a high-yield monthly payer, the total return comparison often reverses the apparent income advantage of the higher-yielding fund. Analyzing high-yield ETF distribution sustainability before committing capital is the step most retail investors skip.
Pro Tip: Use calculators that display a dividend safety score alongside yield. If a tool only shows projected income without flagging payout sustainability, it is giving you half the picture.
How do DRIP and expense ratios change your income projections?
Dividend Reinvestment Plans, known as DRIP, automatically use your dividend payments to purchase additional shares instead of paying cash. Modeling DRIP in a calculator significantly accelerates share accumulation over time. The compounding effect is not linear: each reinvested dividend buys shares that themselves generate future dividends, creating a growth curve that widens with every passing year.
The practical difference between DRIP and cash payouts is substantial over a long holding period. Consider two investors, each putting $50,000 into a fund with a 4% annual yield. The investor taking cash receives steady income but holds the same number of shares throughout. The investor using DRIP owns progressively more shares each quarter, and their annual dividend income grows even if the yield percentage stays flat.
Expense ratio drag works in the opposite direction. Ignoring expense ratios leads to inflated portfolio values in your projections. A 0.65% annual fee on a $100,000 position costs $650 per year at the starting balance, but the real cost compounds as the portfolio grows. Over 20 years, the gap between a 0.06% expense ratio fund and a 0.65% fund is not a rounding error. It is a material difference in ending wealth.
The table below shows how these variables interact in a simplified model:
| Scenario | DRIP | Expense ratio | 20-year outcome |
|---|---|---|---|
| Cash payout, low fee | No | 0.06% | Steady income, moderate growth |
| DRIP, low fee | Yes | 0.06% | Higher total return, growing income |
| Cash payout, high fee | No | 0.65% | Income reduced by fee drag |
| DRIP, high fee | Yes | 0.65% | Compounding partially offset by fees |
Pro Tip: Tax-advantaged accounts like Roth IRAs remove the annual tax friction on reinvested dividends. Running DRIP inside a Roth IRA produces a materially different projection than the same strategy in a taxable brokerage account. Your calculator should let you toggle account type to see the real difference. For a broader view of retirement tax planning, account structure matters as much as yield.
What features make a dividend ETF calculator worth using?
The best dividend ETF calculators share a specific set of features that separate useful tools from misleading ones. The most important is the ability to model after-tax income by account type. Accounting for tax status, whether taxable, Roth IRA, or Traditional IRA, changes projected dividend income significantly. A tool that ignores this produces numbers that look good on screen but do not reflect what you actually keep.
Features that define a high-quality ETF dividend calculator:
- Adjustable payout frequency: Monthly, quarterly, and annual modeling in the same tool.
- DRIP toggle: The ability to switch between reinvestment and cash payout scenarios instantly.
- Expense ratio input: A dedicated field for fund fees, not an optional add-on.
- Dividend growth rate: The ability to model funds that grow their distributions annually, like SCHD, versus funds with flat or declining payouts.
- Yield safety indicators: Flags or scores that highlight unsustainable distribution rates.
- Side-by-side ETF comparison: Advanced comparator tools reveal the long-term impact of fees and dividend strategies across multiple funds simultaneously.
Real-time data integration is a meaningful advantage when it is available. A calculator that pulls live yield and NAV data removes the manual step of sourcing current figures, reducing input errors. For investors tracking funds like VOO, SCHD, SPHD, or high-yield monthly payers, stale data can produce projections that are already outdated on the day you run them.
Combining a calculator with a dividend tracking tool closes the loop between projection and reality. A calculator tells you what you expect to earn. A tracker tells you what you actually received. The gap between those two numbers is where most income investors learn their most expensive lessons.
Key Takeaways
An ETF dividend calculator produces accurate income projections only when it models expense ratios, DRIP compounding, tax status, and dividend safety alongside the headline yield.
| Point | Details |
|---|---|
| Core inputs matter | Investment amount, yield, payout frequency, and time horizon are the minimum required for any useful projection. |
| Yield traps are real | Yields above 12% often signal NAV decay or return-of-capital distributions, not genuine earnings. |
| DRIP compounds meaningfully | Reinvesting dividends accelerates share accumulation and grows income over time, especially in tax-advantaged accounts. |
| Expense ratios compound too | Even a 0.65% annual fee creates a material drag on total return over a 20-year holding period. |
| Safety beats headline yield | Historical payout consistency and growth rate are stronger indicators of dividend quality than current yield alone. |
Why I trust the math more than the marketing on dividend ETFs
The most common mistake I see income investors make is treating a calculator result as a guarantee. A projection is only as reliable as its inputs, and most investors enter the yield they want to believe rather than the yield the fund has actually delivered over time. SCHD investors who model a 3.5% yield based on a trailing 12-month figure get a realistic picture. Investors who plug in a 14% yield from a covered-call fund and assume it holds for 20 years are modeling a fantasy.
NAV decay is the variable that almost never appears in the marketing materials for high-yield ETFs. The distribution looks real because the cash hits your account. But if the fund's share price is falling faster than the dividend is paying, you are running in place at best and losing ground at worst. I have seen investors hold a monthly payer for three years, collect every distribution, and end up with a position worth less than their original investment. The calculator would have shown that outcome clearly if they had modeled NAV alongside income.
The funds with the most boring yield figures, often in the 3%–4% range, tend to produce the best total returns over a decade. Dividend Aristocrats and Dividend Kings earn their reputation not from headline yield but from consistent payout growth. A fund that raises its dividend 6% per year doubles its income contribution in roughly 12 years without you adding a single dollar. That is the math worth running in your calculator.
My practical advice: run every ETF through a calculator twice. First with the current yield and no growth. Then with a conservative growth rate and the actual expense ratio included. The gap between those two projections tells you how much of your expected income depends on assumptions you cannot control.
— Vincent
Evibe's dividend tracker for income investors
Calculators project what you expect to earn. Evibe shows you what you are actually earning, in real time, across every ETF and stock in your portfolio.

Evibe's Dividend Tracker displays executed, declared, and estimated dividends in one place, so you always know where you stand against your income targets. The platform syncs automatically with your brokerage accounts, removing manual entry and the errors that come with it. AI-driven analysis flags changes in portfolio risk and diversification as your dividend positions shift. If you want a single view of your net worth, your income streams, and your ETF performance against major indices, Evibe is built for exactly that.
FAQ
What is an ETF dividend calculator?
An ETF dividend calculator is a tool that estimates dividend income from an ETF position by combining investment amount, yield, payout frequency, reinvestment choice, and expense ratio into a projected income and growth figure.
How does DRIP affect ETF dividend projections?
DRIP reinvests dividend payments into additional shares, accelerating compounding. Over a long holding period, DRIP produces a materially higher total return than taking the same dividends as cash.
What yield percentage signals a dividend yield trap?
Yields above 12% frequently indicate covered-call structures or return-of-capital distributions. These funds often experience NAV decay that offsets or exceeds the income they distribute.
Why does the expense ratio matter in dividend calculations?
Expense ratios reduce net returns every year, and that drag compounds over time. A calculator that excludes fees will overestimate your ending portfolio value, sometimes by a significant margin over a 20-year horizon.
How do I use a dividend calculator for SCHD or VOO?
Enter the fund's trailing 12-month yield, your investment amount, the payout frequency (quarterly for both SCHD and VOO), and the fund's expense ratio. Add a conservative annual dividend growth rate to model how the income stream may grow over your holding period.