Monthly Dividend Calculator: Plan Your Income
Use a monthly dividend calculator to project income accurately. Enter key inputs and plan effectively with Evibe’s private, Apple-native tracker.
Monthly Dividend Calculator: Plan Your Income

TL;DR:
- A monthly dividend calculator estimates your expected monthly income by dividing annual dividends by 12. It helps investors plan investments accurately but should not be mistaken for actual cash flow due to payout timing differences. To achieve a specific income goal, you can reverse the calculation to determine the required investment size based on dividend yield.
A monthly dividend calculator is a tool that converts your dividend investments into an expected monthly income figure, giving income-focused investors a clear number to plan around. The core formula is straightforward: monthly income equals shares owned multiplied by annual dividend per share, divided by 12. That single calculation sits at the heart of every dividend income projection, whether you hold 50 shares of a utility stock or a diversified portfolio across REITs and ETFs. Getting the inputs right, including share count, dividend per share, payout frequency, and your tax rate, determines how useful the output actually is.
How to use a monthly dividend calculator
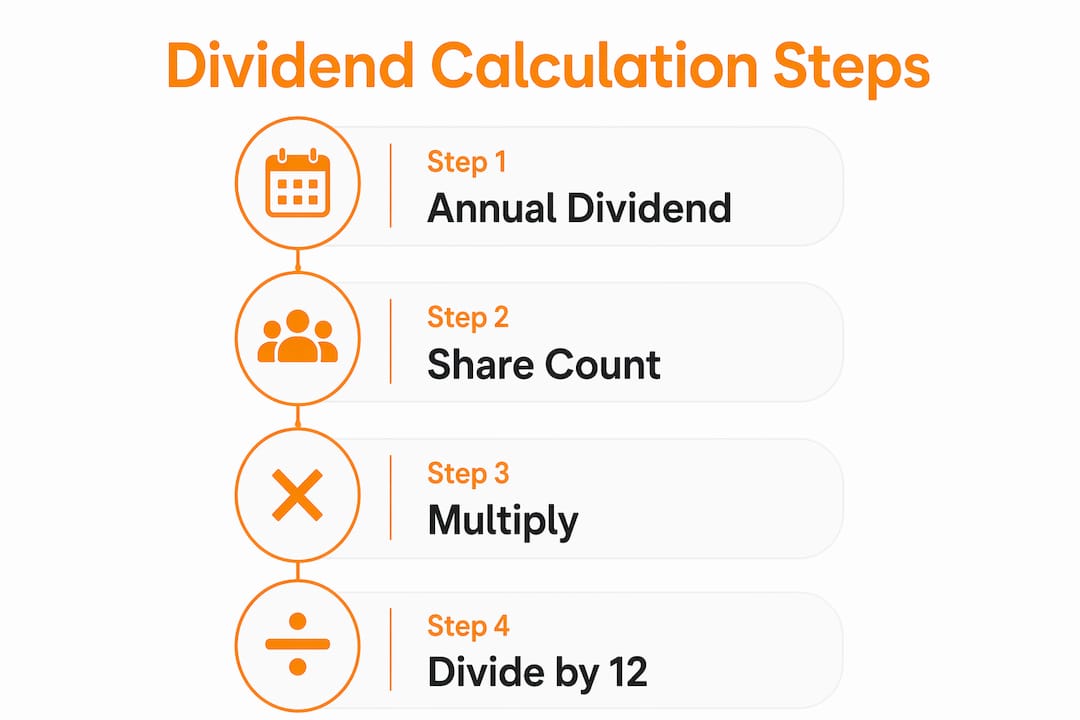
Every accurate dividend income projection starts with four data inputs: number of shares owned, share price, dividend per share or annual yield, and payout frequency. Tax rate is a fifth input worth adding if you want an after-tax figure. Miss any of these, and the output drifts from reality.
Step-by-step calculation process
- Enter your share count. This is the number of shares you currently hold or plan to purchase.
- Input the annual dividend per share. You can find this on the company's investor relations page or any major financial data site.
- Select payout frequency. Annualizing dividends depends on frequency: multiply a monthly dividend by 12, a quarterly dividend by 4, or a semi-annual dividend by 2.
- Apply your tax rate. Federal qualified dividend tax rates run at 0%, 15%, or 20% depending on your income bracket. Applying the right rate gives you a realistic after-tax monthly figure.
- Add a DRIP option if available. Dividend reinvestment plans automatically buy more shares with each payout, compounding your share count and growing future income over time.
The alternative approach skips share count entirely. If you know your total investment amount and the stock's yield, multiply the two and divide by 12. A $50,000 position in a stock yielding 4% annually produces roughly $166 per month before taxes. This method works well when you are evaluating a new position before buying.
Pro Tip: Use the Dividend Income Calculator at Tickerplace to run both the share-count method and the investment-amount method side by side. Comparing both outputs catches data entry errors before they affect your planning.
What payout frequency means for your actual cash flow
Most dividend stocks pay quarterly. That fact changes everything about how you interpret a monthly income figure from a calculator.
Monthly dividend income figures from calculators are mathematical equivalents for budgeting, not actual monthly cash received. A stock paying $1,200 per year shows up as $100 per month in a calculator. In reality, you receive $300 every three months. That distinction matters when you are trying to cover monthly expenses with dividend income.
Here is how the most common payout schedules translate to real cash flow:
- Monthly payers (certain REITs, closed-end funds, and bond ETFs): cash arrives every month, matching the calculator output almost exactly.
- Quarterly payers (most U.S. stocks, including S&P 500 components): cash arrives four times per year, typically in march, june, september, and december.
- Semi-annual payers (common in international stocks): cash arrives twice per year, creating longer gaps between income events.
- Annual payers (some European-listed stocks and certain funds): one lump sum per year, with no monthly cash flow at all.
Pro Tip: Build a staggered portfolio across quarterly payers with different fiscal calendars. A mix of january, february, and march quarter-end stocks can produce income in every single month of the year without relying exclusively on monthly-paying instruments.
Investors who treat the monthly equivalent figure as literal cash flow often find a mismatch between their budget and their bank account. Dividend income figures work best as budgeting tools when you confirm payout timing before committing to a spending plan. Use the monthly figure for annual planning and the actual schedule for month-to-month cash management.
How to size your portfolio for a target monthly income
The most powerful use of a dividend income calculator is working backward from a goal. Instead of asking "how much will I earn," you ask "how much do I need to invest to earn $X per month."

The inverse formula is: required portfolio size equals target monthly income multiplied by 12, divided by dividend yield. At a 4% yield, earning $1,000 per month requires a $300,000 portfolio. That number is concrete and plannable.
Income targets and required portfolio sizes
| Monthly Income Target | At 3% Yield | At 4% Yield | At 6% Yield |
|---|---|---|---|
| $500/month | $200,000 | $150,000 | $100,000 |
| $1,000/month | $400,000 | $300,000 | $200,000 |
| $2,000/month | $800,000 | $600,000 | $400,000 |
The table makes the yield-size tradeoff visible. Chasing a 6% yield to shrink the required portfolio size is tempting, but higher yields carry higher risk. A stock yielding 6% may be pricing in a dividend cut, not rewarding you for patience.
A practical approach runs the calculation in three steps:
- Set your monthly income target in after-tax dollars.
- Convert to a gross annual figure by dividing by 0.85 (assuming a 15% qualified dividend tax rate for most middle-income investors).
- Divide by a conservative yield assumption, typically 3%–4%, to get your target portfolio size.
This process gives you a capital accumulation goal that accounts for taxes and realistic yield expectations. Revisit the calculation annually as your portfolio grows and yields shift.
What can distort your monthly dividend income estimate
Calculators produce estimates, not guarantees. Several factors can push actual income above or below the projected figure.
- Trailing vs. forward yield: Trailing yield is based on past dividends; forward yield uses the latest declared payment annualized. Forward yield is more useful for income planning because it reflects what the company has actually committed to paying next.
- Price-driven yield distortion: Dividend yield moves inversely with stock price. A yield that jumps from 4% to 7% in a month usually signals a falling stock price, not a dividend increase. High yield from price decline is not income security.
- Payout ratio: A lower payout ratio indicates more sustainable dividend payments. A company paying out 90% of earnings as dividends has little room to maintain that payment if earnings dip.
- Dividend cuts and suspensions: Calculators cannot predict management decisions. A company facing cash flow pressure may reduce or eliminate its dividend with little warning.
- Currency risk: For investors holding international dividend stocks, FX rate changes affect the dollar value of each payment, even when the local-currency dividend stays flat.
Successful income investors combine calculator output with payout ratio and company financials to vet dividend sustainability over time. A high yield number in a calculator means nothing if the underlying business cannot support the payment.
Yield on cost adds a useful personal dimension here. It compares your dividend payments to your original purchase price rather than the current stock price. An investor who bought a stock at $20 and now receives $1.20 per share annually has a yield on cost of 6%, even if the stock now trades at $40 and yields only 3% to new buyers. That metric shows how dividend income has grown relative to your actual capital at risk.
Key Takeaways
A monthly dividend calculator converts annual dividend data into monthly income estimates, but accurate planning requires understanding payout timing, yield reliability, and portfolio sizing math.
| Point | Details |
|---|---|
| Core formula | Monthly income equals shares times annual dividend per share, divided by 12. |
| Payout frequency matters | Most stocks pay quarterly; the monthly figure is a budgeting equivalent, not actual monthly cash. |
| Reverse calculation | Divide your annual income target by dividend yield to find the required portfolio size. |
| Forward yield over trailing | Use forward yield for planning; trailing yield reflects the past, not future payments. |
| Payout ratio check | Always verify payout ratio alongside yield to assess whether a dividend is sustainable. |
Why I treat the monthly figure as a planning number, not a paycheck
The most common mistake I see from investors new to dividend income is treating the monthly calculator output as a literal paycheck. They build a monthly budget around $800 in dividend income, then feel blindsided when nothing hits their account in january or february because all their holdings pay in march.
The monthly equivalent is a planning number. It tells you what your portfolio earns on an annualized basis, smoothed into monthly terms. That is genuinely useful for setting savings targets, comparing portfolios, and tracking progress toward an income goal. It is not a cash flow schedule.
What I have found actually works is running two parallel views. The first is the annualized monthly equivalent from a dividend income calculator, which I use for goal tracking and portfolio sizing decisions. The second is a calendar view of actual payout dates, which I use for cash flow management. These two views answer different questions and should never be confused.
The other thing I would push back on is the instinct to maximize yield. Investors who filter for the highest-yielding stocks and build a portfolio around that screen often end up holding companies with deteriorating fundamentals. The payout ratio is the first number I check after yield. A 7% yield with a 95% payout ratio is a warning sign. A 4% yield with a 45% payout ratio is a foundation.
Use the calculator as a flexible projection tool. Run it with conservative yield assumptions. Then check the best dividend tracker apps to monitor whether actual payments match your projections over time. The calculator sets the target. Real-time tracking tells you if you are hitting it.
— Vincent
Evibe's dividend tracker for real-time income monitoring
Calculators give you projections. Evibe gives you the live picture.

Evibe's dividend tracker shows executed, declared, and estimated dividends across your entire portfolio in one place. You can select payout frequencies, run projection scenarios, and see how your actual income compares to your plan in real time. There is no manual entry. Evibe syncs directly with your brokerage accounts and updates automatically when dividends are declared or paid. For investors who use a monthly dividend income calculator to set goals, Evibe closes the loop by showing whether those goals are being met. If you also hold ETFs, the ETF portfolio tracker covers distributions from fund holdings alongside individual stock dividends.
FAQ
What is a monthly dividend calculator?
A monthly dividend calculator estimates your expected monthly income from dividend-paying investments by dividing annual dividend income by 12. The core inputs are shares owned, annual dividend per share, payout frequency, and optionally your tax rate.
How do I calculate monthly dividend income from a quarterly-paying stock?
Multiply the quarterly dividend per share by 4 to get the annual figure, then multiply by your share count and divide by 12. This gives you the monthly equivalent for budgeting, though actual cash arrives four times per year.
How much do I need to invest to earn $1,000 per month in dividends?
At a 4% annual yield, you need a $300,000 portfolio to generate $1,000 per month in dividend income. At a 3% yield, the required amount rises to $400,000.
What is the difference between trailing and forward dividend yield?
Trailing yield is calculated from dividends paid over the past 12 months. Forward yield uses the latest declared payment annualized, making it more relevant for projecting future income.
Why does a high dividend yield sometimes signal risk?
Yield rises when stock price falls, since yield equals annual dividend per share divided by share price. A sudden yield spike often reflects a price drop rather than a dividend increase, and may precede a dividend cut if the payout ratio is unsustainable.