Time-Weighted Return: How to Calculate and Use TWR
Discover how to calculate time-weighted return to measure investment performance accurately, stripping out the impact of deposits and withdrawals.
Time-Weighted Return: How to Calculate and Use TWR

Time-weighted return (TWR) is the compound growth rate of a portfolio's underlying investments, calculated after stripping out the effect of deposits and withdrawals. Portfolio managers use it for one main reason: it isolates skill from timing. When you or your advisor add money right before a rally or pull money out before a downturn, TWR ignores that timing entirely and tells you how the strategy itself performed.
This matters because the alternative, money-weighted return, would penalize or reward a manager for decisions you made about when to invest, not for how well they managed your capital. That is why TWR is the standard used across GIPS-compliant performance reporting and why nearly every institutional fact sheet you have ever read quotes it instead of a raw account return. If you have ever wondered why your brokerage statement shows a different percentage than your fund's official performance report, this is usually the reason.
Key Takeaways
Time-weighted return isolates strategy performance by neutralizing cash flow timing, and calculating it accurately requires valuations at every external flow date, not just at period end.
| Point | Details |
|---|---|
| Use TWR for manager evaluation | Choose TWR when benchmarking a fund manager or strategy against an index, since it removes your own timing decisions from the result. |
| Use MWR for personal experience | Choose IRR or XIRR when you want to know how your actual contributions and withdrawals performed over time. |
| Calculation needs precise valuations | Break the period at each cash flow, calculate each sub-period HPR, then multiply the (1 + HPR) factors together. |
| Approximate carefully when data is missing | Modified Dietz and linked IRR are reasonable substitutes for true TWR but diverge more as flows grow larger or markets get more volatile. |
| Automation reduces valuation errors | Evibe syncs accounts and captures valuations automatically, cutting the manual reconciliation work behind accurate TWR reporting. |
Table of Contents
- What Does Time-Weighted Return Actually Measure?
- How Do You Calculate Time-Weighted Return?
- A Worked Example of Time-Weighted Return
- How Do You Annualize TWR Over Irregular Periods?
- TWR vs Money-Weighted Return: Which One Should You Use?
- What Are the Advantages and Limitations of TWR?
- How Do You Compute TWR in a Spreadsheet or Automated Tool?
- Can Automated Portfolio Tracking Improve TWR Accuracy?
- A Practitioner's Note on Reporting TWR
- Track TWR Automatically With Evibe
- Where to Verify TWR Definitions and Formulas
- Frequently Asked Questions
- Sources
What Does Time-Weighted Return Actually Measure?
TWR measures the return an investment would have generated if no external cash flows had ever occurred. It answers a narrow but important question: how did the assets themselves perform, independent of when money moved in or out?
The "time-weighted" label comes from the mechanics of the calculation. Instead of averaging returns over the whole period in one shot, you break the timeline into sub-periods, each one bounded by a deposit or withdrawal. You calculate a return for each slice of time, then link those returns together geometrically, compounding them like interest. Investopedia describes this as isolating the performance of the underlying investments while neutralizing the impact of external cash flows, which is the cleanest one-line summary of what the formula is doing under the hood.
The finance industry adopted this approach because manager comparisons demanded fairness. If two managers both delivered 8% on the assets they controlled, but one client withdrew heavily during a rally and the other did not, a simple account-level return would make one manager look far worse for no fault of their own. INREV notes that TWR is typically the standard for evaluating manager skill and benchmarking against indices precisely because it removes that client-driven noise. GIPS composites, the accepted global framework for reporting investment performance, generally require TWR for this reason.
Here is the practical distinction worth remembering: what you experience as an investor and what TWR reports are often two different numbers. You might feel like you underperformed the market because you bought in at a bad time. TWR does not care about that. It only cares about what happened to a dollar that sat in the strategy for the entire measured period.
How Do You Calculate Time-Weighted Return?
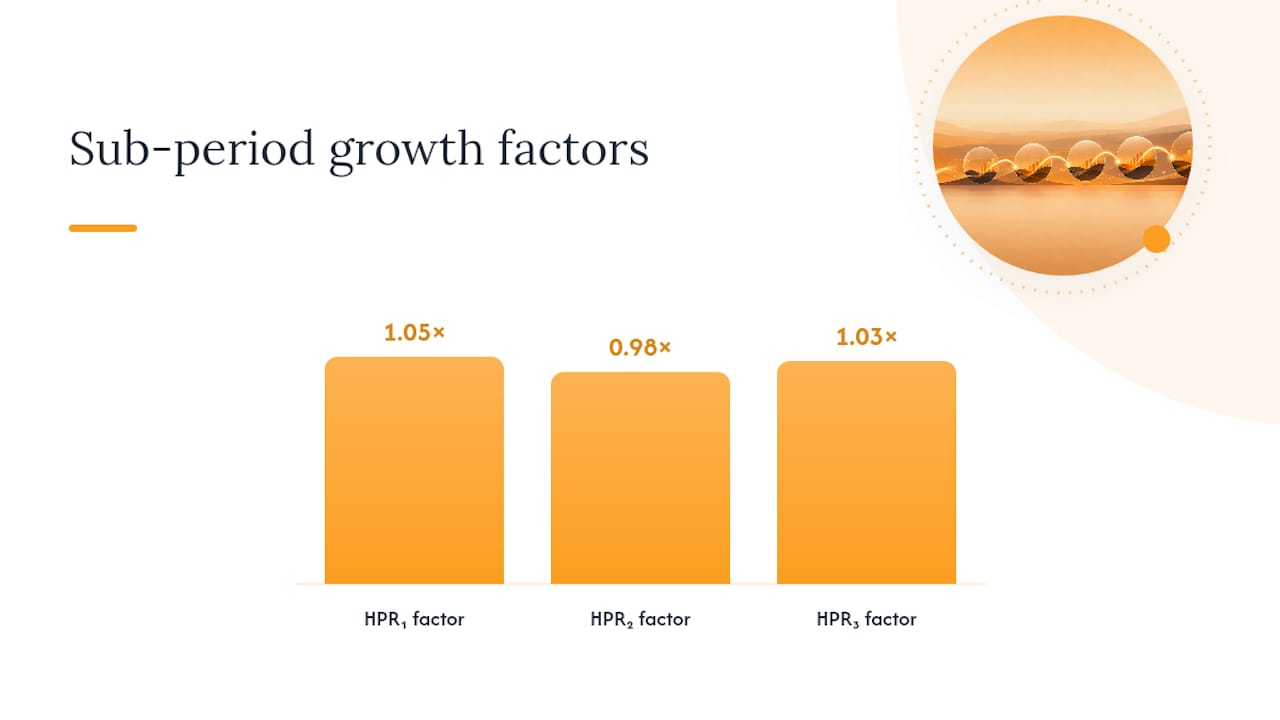
The compounded TWR formula is a product of sub-period growth factors, minus one:
TWR = [(1 + HPR₁) × (1 + HPR₂) × (1 + HPR₃) × … × (1 + HPRₙ)] − 1
Each HPR is a holding period return, the return earned during one slice of time between cash flows. Before you can compute any of them, you need to define a few symbols:
- BMV — beginning market value of the sub-period.
- EMV — ending market value of the sub-period, measured right before the next cash flow hits.
- CF — the external cash flow (deposit or withdrawal) that triggers a new sub-period.
- HPR — the sub-period return, calculated as (EMV − BMV) ÷ BMV.
- n — the total number of sub-periods in the full measurement window.
Wikipedia's entry on time-weighted return lays out this linking approach clearly: divide the overall period into sub-periods at each external flow, calculate each sub-period's HPR, then geometrically link the (1 + HPR) factors. Here is the reproducible sequence:
- Identify every external cash flow in the measurement window, including contributions, withdrawals, and any transfers in or out.
- Create a new sub-period boundary at each flow. A single day with a deposit becomes the end of one sub-period and the start of the next.
- Value the portfolio immediately before each flow to get the EMV for the closing sub-period, and immediately after the flow to get the BMV for the next one.
- Compute the HPR for each sub-period using (EMV − BMV) ÷ BMV.
- Convert each HPR into a growth factor by adding 1 (so a 4% return becomes 1.04).
- Multiply all the growth factors together, then subtract 1 to get the compounded TWR for the full period.
- Annualize the result if your measurement window spans more or less than one year.
A quick algebraic template you can drop into a spreadsheet: if HPR₁ = 0.05, HPR₂ = −0.02, and HPR₃ = 0.03, then TWR = (1.05 × 0.98 × 1.03) − 1, which equals roughly 0.0592, or 5.92% for the combined period. AnalystPrep's CFA Level 1 material frames this exact workflow: compute each HPR, multiply the (1 + HPR) terms, then annualize separately once you have the compounded figure.
A Worked Example of Time-Weighted Return
Numbers make this stick better than formulas alone. Say you are tracking a portfolio over a three-month stretch with two deposits along the way.
| Sub-period | Beginning value (BMV) | Cash flow (CF) | Ending value (EMV, before next flow) |
|---|---|---|---|
| Jan 1 to Jan 31 | $10,000 | none | $10,400 |
| Feb 1 to Feb 28 | $10,400 + $2,000 = $12,400 | $2,000 deposit on Feb 1 | $12,152 |
| Mar 1 to Mar 31 | $12,152 | none | $12,516 |
Now walk through the step calculations. In January, HPR₁ = ($10,400 − $10,000) ÷ $10,000 = 0.04, or 4%. In February, HPR₂ = ($12,152 − $12,400) ÷ $12,400 = −0.02, or negative 2%. In March, HPR₃ = ($12,516 − $12,152) ÷ $12,152 = 0.03, or 3%.
Link the growth factors: (1.04) × (0.98) × (1.03) = 1.0499.
Since this covers a quarter rather than a full year, you would annualize using (1 + 0.0499)^(4) − 1, which works out to a notable annualized rate. That annualized figure only makes sense as a projection, not a promise. It assumes the same quarterly pace repeats four times, which real markets rarely do.
Now compare that to the money-weighted return for the same cash flows. TWR ignores that timing entirely. MWR does not. That gap is the whole point of running both numbers side by side.
How Do You Annualize TWR Over Irregular Periods?
Once you have a compounded TWR for the full measurement window, converting it to an annual rate uses a straightforward formula:
Annualized TWR = (1 + TWR)^(1/years) − 1
Here, "years" is the fraction of a year covered by your measurement period, expressed as a decimal. A nine-month period is 0.75 years. A 40-day stretch is roughly 0.11 years. AnalystPrep's CFA materials confirm this annualization step is applied separately from the linking calculation, meaning you first compound the sub-period HPRs, then raise the result to the annualizing exponent.
Irregular sub-period lengths do not break the math, but they do require discipline about dates. If your first sub-period is 12 days and your second is 47 days, you still calculate each HPR independently and link the growth factors exactly as before. The linking formula does not care how long each slice is, only that each one starts and ends at a valid valuation point.
Where things get trickier is when you are comparing performance across accounts with different measurement windows. In those cases, some practitioners convert sub-period returns into continuous, or logarithmic, returns before linking, since log returns are additive rather than multiplicative and simplify some downstream statistical work. For most retail and advisory use cases, the standard geometric linking method above is sufficient, and log returns are more of a quant-shop convention than a requirement.
Pro Tip: Always convert your measurement window to exact fractional years using actual calendar days, not a rounded month count. A "12-month" period that actually spans 366 days versus 365 will shift your annualized rate slightly, and that shift compounds over multi-year reporting.
TWR vs Money-Weighted Return: Which One Should You Use?
TWR and money-weighted return (MWR, typically calculated as IRR or XIRR) answer fundamentally different questions, and mixing them up is one of the most common mistakes in performance reporting.
| Question | Time-weighted return | Money-weighted return |
|---|---|---|
| What does it measure? | Performance of the strategy or manager, independent of cash flow timing | The investor's actual dollar experience, including when and how much they contributed |
| Who controls the cash flows? | Best when the manager controls flows, or flows are irrelevant to the question | Best when the investor controls flows (retirement accounts, brokerage accounts) |
| Typical use case | GIPS composites, mutual fund fact sheets, manager benchmarking | Personal portfolio review, private equity, venture capital |
| Calculation complexity | Requires valuations at every flow date | Requires solving for a discount rate (IRR); XIRR handles irregular dates |
| Sensitivity to flow timing | None by design | High, by design |
M1's comparison of these two metrics puts it plainly: TWR isolates manager performance while MWR captures the investor's actual experience, timing and flow size included. Neither metric is "more correct." They are built to answer different things.
Use TWR when you are benchmarking a fund manager against an index or a peer group, since that manager did not choose when your contributions landed. Use IRR or XIRR when you want to know how well your own actual investment decisions performed, especially in private equity or venture capital, where the general partner controls the timing of capital calls and distributions and you are the one bearing the consequences of that timing. XIRR in particular is worth knowing by name, since it solves for irregular, non-annual cash flow dates, which is exactly the situation most retail portfolios and private funds present.
What Are the Advantages and Limitations of TWR?
TWR earns its place as the industry default for a few concrete reasons, but it is not free of blind spots.
On the advantage side, TWR neutralizes external flows, which makes manager-to-manager comparisons fair regardless of how much money each client happened to add or remove. It aligns with GIPS reporting standards, which means a TWR figure on a fund fact sheet is speaking the same language as every other GIPS-compliant number you might compare it against. It also isolates the one variable most investors actually want to judge, which is whether the strategy itself is any good.
The limitations show up mostly around data requirements. True TWR needs a portfolio valuation at the exact moment of every external flow, not just at month-end or quarter-end. Kitces' analysis of TWR, MWR, and valuation frequency points out that without those flow-timestamp valuations, true TWR cannot be calculated exactly, which forces most systems into approximation territory. TWR also does not reflect the investor's lived experience. If you dumped a large sum in right before a crash, your account balance tells a very different story than the TWR headline number does. For small, cash-heavy accounts, or for private equity vehicles where the general partner controls capital calls, TWR can paint a picture that has little bearing on what the investor actually felt.
Pro Tip: Watch your valuation timing closely. A sub-period return calculated from a valuation that lags the actual cash flow date by even one trading day can shift that slice's HPR meaningfully, especially in volatile markets, and that error compounds through every subsequent link in the chain.
How Do You Compute TWR in a Spreadsheet or Automated Tool?
Most practitioners never calculate TWR by hand past a teaching example. In real workflows, the calculation runs through a spreadsheet or a portfolio tracking system, and the setup matters as much as the formula.
- Build a transaction and valuation log with one row per date, tracking BMV, any cash flow, and EMV for each sub-period.
- Add an HPR column using the formula (EMV − CF adjustment − BMV) ÷ BMV for each row.
- Add a growth factor column that adds 1 to each HPR.
- Link the growth factors using a
PRODUCT()formula across the whole column, then subtract 1 to get compounded TWR. Some practitioners useGEOMEAN()for a related geometric-average calculation, thoughPRODUCT()is the direct match for the standard TWR formula, as Capital City Training's breakdown of the calculation confirms. - Annualize using the (1 + TWR)^(1/years) − 1 formula in a separate cell, referencing your fractional-year count.
- Cross-check against XIRR on the same raw cash flows and dates, using your spreadsheet's built-in
XIRR()function, to see how far TWR and MWR diverge for that account.
When you do not have valuations at every flow date, exact TWR is not calculable, and this is where approximation methods earn their keep. The Modified Dietz method weights each cash flow by the fraction of the period it was invested, and it produces results close to true TWR over short intervals with modest flows. Linked IRR, sometimes called LIROR, chains together IRR calculations across shorter sub-periods as a hybrid approach. Both approximations diverge more sharply from true TWR when flows are large relative to portfolio size or when markets are especially volatile during the measurement window, so treat them as reasonable estimates, not substitutes, once your flows get large or frequent.
Data quality is the quiet killer of reproducible TWR. Missing valuation dates, inconsistent cutoff times between custodians, and manually re-entered transaction data are the usual suspects behind a TWR number that will not reconcile between two systems. Before you trust any TWR figure for a report, reconcile the transaction count and total cash flow against your custodian statements first. For a broader look at how different reporting tools handle this reconciliation problem, Evibe's comparison of portfolio management alternatives covers where TWR, IRR, and Dietz-based reporting tend to differ across platforms, and traders managing multiple brokerage accounts often face a related version of this problem, covered in this primer on trading performance tracking methods.
Can Automated Portfolio Tracking Improve TWR Accuracy?
Every pitfall in the sections above traces back to one root cause: missing or mistimed valuations. Manual spreadsheets are only as good as the data entered into them, and the more frequently money moves in and out of a portfolio, the more sub-period boundaries you need to track by hand.
This is where automation changes the equation. Evibe syncs bank and brokerage accounts automatically, which means valuations update in real time rather than at whatever cadence someone remembers to log them. Every account connection generates a timestamped record, so when a deposit or withdrawal hits, the system already has the valuation on file, exactly the input Kitces identifies as the requirement for calculating true TWR rather than an approximation.

Multi-asset support matters here too. A portfolio that spans stocks, ETFs, options, crypto, and real estate has cash flows and valuation events happening on different schedules across different institutions, and reconciling all of that manually is where most spreadsheet-based tracking breaks down. Evibe's mark-to-market valuation approach applies consistent timing logic across asset classes, which matters directly for TWR accuracy, since a stale or mistimed valuation on even one asset class can throw off an entire sub-period's HPR.
Frequent small contributions, the kind many active investors make every payday, create exactly the "valuation fatigue" problem Kitces describes in the context of high cash-flow accounts. Automated syncing removes the burden of logging each one by hand, along with the human error that creeps in when someone is manually splitting a month into six sub-periods because of biweekly deposits.
A Practitioner's Note on Reporting TWR
If you present performance to clients or an investment committee, lead with TWR when the conversation is about the strategy or the manager, and switch to MWR the moment the conversation turns to what the client's own money actually did.
The real value of running both numbers is diagnostic. When TWR and MWR sit close together, cash flow timing was not a significant factor for that account. When they diverge sharply, you have a timing story worth telling, whether that means the client added money right before a downturn or a manager received a large capital call right before a rally. That gap is more informative than either number alone, and it is worth building into every quarterly report rather than reserving it for the years when the two numbers happen to disagree.
Track TWR Automatically With Evibe
Manual spreadsheets can calculate TWR correctly, but only if every valuation, cash flow date, and sub-period boundary gets entered without a mistake, and that gets harder every time you add an account or an asset class. Evibe removes that manual burden by syncing your bank and brokerage accounts automatically, so valuations are captured at the moments that matter rather than reconstructed after the fact.

Evibe consolidates stocks, ETFs, options, crypto, real estate, and other holdings into a single dashboard, with dividend tracking, options analytics, and benchmarking against major indices built in. It is built for active investors and managers who need performance numbers they can trust without reconciling five spreadsheets by hand. If frequent contributions or a multi-asset portfolio have made your own TWR tracking a monthly headache, get started free with Evibe and see your consolidated performance update automatically the next time your accounts sync.
Where to Verify TWR Definitions and Formulas
For the formal definition and geometric linking mechanics behind TWR, Wikipedia's time-weighted return entry lays out the formula and approximation methods in detail. Investopedia's explainer is the faster read if you want the definition and industry context without the formula derivation. For a CFA-level worked example with the annualization step spelled out, AnalystPrep's Level 1 material is the most exam-rigorous source available. If you are weighing TWR against IRR for a specific reporting decision, M1's comparison of the two metrics frames the practical tradeoffs clearly. And for the valuation-frequency problem that trips up most real-world TWR calculations, Kitces' deep dive on TWR, MWR, and reporting software methodology is the most thorough treatment of why exact TWR is harder to produce than the textbook formula suggests.
Frequently Asked Questions
What is the difference between TWR and total return?
Total return measures the simple change in value over a period, including all cash flows, while TWR strips out the effect of those cash flows entirely. Total return tells you what happened to your account balance. TWR tells you what happened to the underlying strategy.
Why does TWR require valuations at every cash flow date?
Because each cash flow marks the boundary of a new sub-period, and calculating an accurate holding period return for that sub-period requires knowing the portfolio's exact value immediately before and after the flow occurred. Without that valuation, you cannot compute a true HPR for that slice of time.
Can I calculate TWR without daily valuations?
Yes, using approximation methods like Modified Dietz or linked IRR, though these produce estimates rather than exact TWR figures, and the gap between the approximation and the true value grows as cash flows get larger or more frequent.
Is TWR better than IRR?
Neither is "better." TWR is the right choice for evaluating a manager or strategy's skill, since it ignores flow timing. IRR, or XIRR for irregular dates, is the right choice for understanding your own actual investment experience, since it accounts for exactly when your money moved.
How do I annualize a TWR calculated over 18 months?
Convert the total compounded TWR using the formula (1 + TWR)^(1/1.5) − 1, since 18 months equals 1.5 years. This converts your multi-period result into an annualized rate for comparison against annual benchmarks.
This article is general information, not a substitute for advice from a qualified financial advisor. Consult a qualified financial professional about your own circumstances before acting on anything here.
Sources
- Time-Weighted Rate of Return: What Is It and How Do You ...
- Time-weighted return
- Time-Weighted Rate of Return | CFA Level 1