Dividend Yield Calculator: Estimate Income and Yield
Use our dividend yield calculator to estimate stock income and compare yield across your portfolio. Track it all privately in Evibe’s Apple-native app.
Dividend Yield Calculator: Estimate Income and Yield

TL;DR:
- A dividend yield calculator determines the income relative to a stock's price using annual dividends and current share price. It helps compare holdings quickly and estimate portfolio income, but must be paired with payout ratio and cash flow checks for reliability.
A dividend yield calculator takes two inputs, annual dividends per share and current share price, and returns a single percentage that tells you how much income a stock pays relative to its price. The dividend yield formula is straightforward: Dividend yield = annual dividends per share ÷ current share price. A stock paying $3.00 annually and trading at $75.00 yields exactly 4.0%. That example uses a forward-looking input, meaning the most recent quarterly payment ($0.75) multiplied by four to annualize it. We make that assumption explicit throughout this guide.
Quick take: Use a dividend yield calculator to compare income across holdings at a glance and to estimate how much cash your portfolio generates each year. The sections below show you exactly how to enter inputs, choose the right annualization method, and avoid the most common mistakes.
The S&P 500 average dividend yield is generally low, with values around 1.3–1.5% in 2026, meaning any stock yielding 3% or more is already well above the broad-market baseline. That context matters before you run a single number.
Table of Contents
- How to use a dividend yield calculator: inputs and options
- The dividend yield formula and how to work through the math
- Forward-looking vs TTM annualization: which method fits your situation
- How to interpret dividend yield: ranges, red flags, and sustainability
- Estimating portfolio dividend income, modeling DRIP, and calculating yield-on-cost
- What a calculator cannot tell you, and which metrics to track alongside it
- Key Takeaways
- The yield number is only half the story
- Evibe tracks your dividend yield automatically, across every holding
- Authoritative sources and further reading
How to use a dividend yield calculator: inputs and options
Every reliable calculator needs three required inputs and handles several optional fields that sharpen your income projections.
Required inputs:
- Current share price — the live or most recent closing price of the stock
- Annual dividend per share — either the stated annual figure or a recent payment amount plus its frequency (quarterly, monthly, semiannual, annual)
- Number of shares or total position value — needed to convert yield into a dollar income estimate
Optional fields worth using:
- Dividend growth rate — models how income compounds if the company raises its payout annually
- Expected share-price growth — factors in capital appreciation alongside income
- Reinvestment (DRIP) — shows how automatically reinvesting dividends increases your share count and future income
- Currency/FX — critical for U.S. investors holding international stocks, since exchange-rate moves affect the dollar value of foreign dividends
- Tax assumptions — lets you model after-tax income based on qualified vs. ordinary dividend treatment
A practical calculator should handle frequency conversion automatically: enter a $0.— monthly payment and it multiplies by 12; enter a $1.25 quarterly payment and it multiplies by 4. If yours does not, the conversion table in the next section covers it.
Pro Tip: Use forward-looking input (most recent payment × frequency) for companies with stable, recently raised dividends. Switch to the TTM sum when a company pays irregular amounts or has issued special distributions in the past year — the forward method will overstate expected income in those cases.

The dividend yield formula and how to work through the math
The arithmetic has three steps: annualize the dividend, divide by price, multiply by 100.
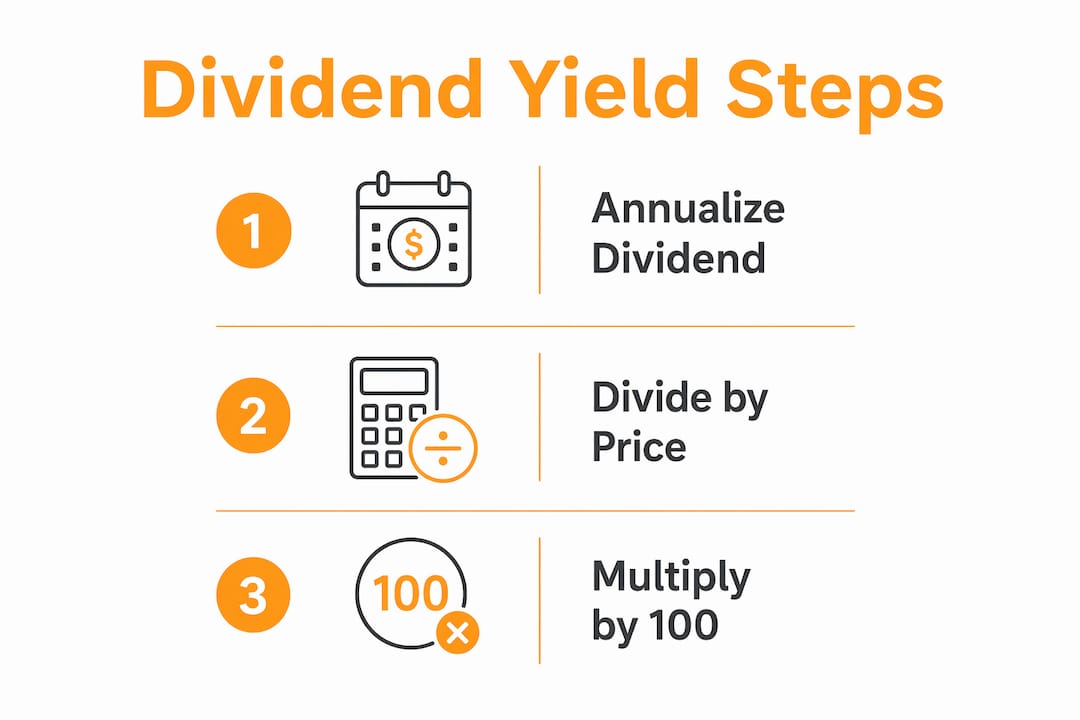
Step 1: Annualize the dividend per share based on payment frequency. Step 2: Divide by the current share price. Step 3: Multiply the decimal result by 100 to get a percentage.
Worked example 1: single stock
A company pays a quarterly dividend of $0.60 per share. The stock trades at $48.00.
- Annualized dividend: $0.60 × 4 = $2.40
- Yield: $2.40 ÷ $48.00 = 0.05 = 5.0%
Worked example 2: portfolio position
You own 200 shares of that same stock.
- Annual income: $2.40 × 200 = $480.00
- Portfolio yield on this position: $480 ÷ ($48.00 × 200) = $480 ÷ $9,600 = 5.0%
The yield is identical whether you calculate per share or on the full position, as long as you use a consistent price basis.
Frequency conversion reference
| Payment frequency | Conversion | Example payment | Annualized dividend |
|---|---|---|---|
| Quarterly | × 4 | $0.75 | $3.00 |
| Monthly | × 12 | — | $3.00 |
| Semiannual | × 2 | — | $3.00 |
| Annual | × 1 | $3.00 | $3.00 |
| TTM (trailing 12 months) | Sum of actual payments | — | — |
The TTM row illustrates why the two methods can diverge. A company that raised its dividend mid-year shows a higher forward estimate than its TTM sum reflects.
For ETF-specific distribution handling, the ETF dividend calculator guide covers how fund-level yields differ from individual-stock yields.
Forward-looking vs TTM annualization: which method fits your situation
Both methods are legitimate. The choice depends on the company's payment history.
Forward-looking (most recent payment × frequency)
- Reflects the current payout rate immediately after a raise
- Works well for Dividend Aristocrats and other companies with consistent quarterly schedules
- Can mislead when a company paid a large special dividend recently, since multiplying that one-time amount by four produces an inflated annual estimate
TTM (sum of last 12 months' actual payments)
- Factual: it uses what the company actually paid, not a projection
- Safer for real estate investment trusts, business development companies, and other variable-payout structures
- Lags when a company raised its dividend recently, understating the current run rate
Practical guidance:
- Stable dividend growers with a regular quarterly schedule: use forward-looking
- Companies with variable or special distributions: use TTM
- Special or one-off dividends distort forward estimates; when in doubt, check the company's declared dividend history before choosing a method
How to interpret dividend yield: ranges, red flags, and sustainability
Yield is a snapshot. The number changes every time the stock price moves, even if the dividend stays flat. A stock that yields 8% today may have yielded 4% six months ago simply because the price fell by half.

The S&P 500 baseline of roughly 1.3–1.5% means that utilities, REITs, and consumer staples regularly yield 3–5%, while growth-oriented technology companies often yield under 1% or nothing at all. Neither extreme is automatically good or bad. Context is everything.
Red flags to watch:
- Yield spiking because the share price dropped sharply, not because the dividend increased
- Payout ratio above 100% (the company is paying out more than it earns)
- Dividend growth history that has stalled or reversed
- Management commentary in SEC filings signaling a potential cut
A yield trap is exactly this: a rising yield caused by a falling price that masks a business under stress. Always validate a high yield with payout ratio and free-cash-flow coverage before treating it as income you can count on. Tools like FilingsIQ can help you scan SEC filings for dividend coverage commentary without reading every 10-K manually.
Sustainability checks to run:
- Payout ratio = dividends paid ÷ net income; below 60% is generally comfortable for most sectors
- Free cash flow yield = free cash flow per share ÷ price; confirms the company generates enough cash to fund the dividend
- Dividend growth rate over 3–5 years; consistent growth signals management confidence
On taxes: qualified dividends paid by U.S. corporations generally receive preferential tax treatment compared to ordinary income, but withholding taxes may reduce the net cash you receive from foreign holdings. Consult a tax advisor for your personal tax treatment.
Estimating portfolio dividend income, modeling DRIP, and calculating yield-on-cost
To estimate total annual income across a portfolio, multiply each holding's annualized dividend per share by the number of shares you own, then sum across all positions. For a monthly income estimate, divide the annual total by 12.
Sample 3-stock portfolio
| Stock | Shares | Dividend/share (annual) | Annual income |
|---|---|---|---|
| Stock A | 100 | $3.00 | — |
| Stock B | — | $2.40 | — |
| Stock C | 200 | — | — |
Monthly income estimate: $660 ÷ 12 = $55.00/month
Portfolio yield = $660 ÷ total position value. If the combined market value of these three positions is $15,000, the portfolio yield is 4.4%.
Yield-on-cost
Yield-on-cost uses your original purchase price rather than today's market price: annual dividend ÷ original purchase price. If you bought Stock A at $30.00 per share and it now pays $3.00 annually, your yield-on-cost is 10.0%, even though the current market yield might be 4%. Long-term holders track this figure because it shows how their personal income rate has grown as the company raised its payout over time.
DRIP illustration
Reinvesting dividends automatically purchases additional shares each payment period. A position that generates $300 in annual dividends, reinvested into shares priced at $30, adds 10 shares per year. Those 10 shares generate their own dividends the following year, compounding the income base. Over a decade, the difference between a DRIP and a cash-out strategy on a growing dividend can be substantial. For a deeper look at building monthly income projections from mixed-frequency holdings, the monthly dividend calculator guide walks through the aggregation step-by-step.
What a calculator cannot tell you, and which metrics to track alongside it
A yield figure is only as reliable as the inputs and assumptions behind it. Several real-world factors fall outside what any static calculator captures.
Core limitations:
- Share price volatility changes yield continuously; a calculation from last week may already be stale
- Dividends can be cut or suspended with little warning; the calculator has no predictive power here
- Special dividends inflate forward estimates if you use the most recent payment as your base
- Currency moves reduce the dollar value of foreign dividends for U.S. investors holding international stocks
- Withholding taxes on foreign dividends reduce net cash received below the gross yield figure
Complementary metrics to track alongside yield:
- Payout ratio (dividends ÷ earnings)
- Dividend growth rate over 3 and 5 years
- Free cash flow yield
- Total return (yield + price appreciation) for a complete picture of investment performance
FX risk deserves specific attention. A European stock yielding 5% in euros may deliver less than 4% in dollars after an unfavorable exchange-rate move. If you hold international positions, model the yield in your home currency and revisit it when rates shift materially.
Pro Tip: Use Evibe's dividend tracker to sync dividend payments automatically, apply historical FX rates to foreign holdings, and eliminate the manual frequency-conversion errors that creep into spreadsheet-based calculations.
Key Takeaways
A dividend yield calculator is most useful when you pair the formula with the right annualization method and validate the result against payout ratio and cash-flow data.
| Point | Details |
|---|---|
| Use the right method | Forward-looking works for stable payers; TTM is safer for irregular or special-dividend stocks. |
| Watch for yield traps | A yield rising because the share price fell is a warning sign, not an opportunity — check payout ratio first. |
| Model yield-on-cost | Long-term holders should track annual dividend ÷ original purchase price to see their true personal income rate. |
| Account for FX and taxes | Foreign dividends lose value through withholding taxes and currency moves; model both before counting on the income. |
| Automate with Evibe | Evibe syncs dividend history, applies historical FX rates, and models DRIP across your full portfolio automatically. |
The yield number is only half the story
Dividend yield gets most of the attention, but in practice the investors who build reliable income streams focus more on sustainability than on the headline percentage. A 6% yield from a company with a 95% payout ratio and declining free cash flow is a weaker position than a 3% yield from a company that has raised its dividend every year for a decade.
The other thing that gets underestimated: yield-on-cost. Most calculators show you the current market yield, which is useful for comparing stocks today. But for a long-term holder, the relevant number is what the dividend pays relative to what you actually paid. A stock bought at $20 that now pays $2.00 annually is a 10% yield-on-cost, regardless of where the market prices it today. That figure tells you something a current-yield snapshot never will.
Manual calculations work fine for a single stock. For a portfolio of 10 or 20 holdings across different payment frequencies and currencies, the error rate climbs fast. We have seen investors double-count a special dividend, forget to convert semiannual payers, or miss a withholding tax on a Canadian holding entirely. Automation is not a luxury at that point; it is just accuracy.
Evibe tracks your dividend yield automatically, across every holding
Running a one-off calculation is a good start. Keeping that calculation current across a full portfolio, in real time, is where most manual approaches break down.
Evibe was built for exactly this. The app automatically imports dividend history for your stocks and ETFs, applies historical FX rates to international holdings, and calculates both current yield and yield-on-cost without any manual entry. You can model DRIP scenarios, set smart alerts for dividend changes, and see your projected annual and monthly income updated as prices move.

For investors who want to move beyond a static spreadsheet, Evibe consolidates every dividend-paying asset, from U.S. equities to foreign stocks to ETFs, into a single dashboard with AI-driven analysis of your income, risk, and diversification. The subscription is managed through the Apple App Store with monthly or annual billing.
Start with the dividend tracker to see your full income picture, or visit Evibe to track your entire portfolio in real time.
This article is general information, not personalized financial or tax advice. Confirm current tax treatment with a qualified tax advisor or the IRS for your specific situation.
Authoritative sources and further reading
The sources below back the key claims in this guide. Each one is worth bookmarking for a specific purpose.
- Investopedia — Dividend Yield: Best for the core formula, yield trap explanation, and payout ratio context.
- Fidelity — Dividend Yield: What It Is and How to Calculate It: Best for forward vs TTM methodology and guidance on special dividends.
- FinCalcs — Dividend Yield Calculator: Practical calculator with frequency-conversion handling and S&P 500 yield context.
- DivCalc — Dividend Yield Calculator: Covers yield-on-cost and DRIP modeling in a usable calculator format.
- IRS Topic 404 — Dividends: Primary source for qualified dividend tax treatment for U.S. investors.
- FilingsIQ: Automated SEC filings analysis for validating dividend coverage and payout commentary in 10-K and 10-Q filings.
- Evibe — Portfolio Dividend Calculator Guide: Explains portfolio-level dividend modeling and Evibe's automated tracking features.
- Evibe — Dividend Income Calculator Guide: Covers income projections and tax-aware planning for U.S. investors.
For personalized tax treatment of dividends, including qualified dividend rates and foreign withholding, consult a qualified tax advisor.