VTI DRIP Calculator: Project Your Dividend Returns
VTI DRIP calculator: project dividend returns and reinvestment growth over time. Plan smarter, build long-term wealth, and track it privately with Evibe.
VTI DRIP Calculator: Project Your Dividend Returns

A VTI DRIP calculator projects the compounded growth of your Vanguard Total Stock Market ETF position by modeling what happens when every quarterly dividend buys more shares instead of sitting in cash. The core insight: at VTI's current yield of about 1.03%, dividend income alone won't build wealth quickly, but reinvestment combined with consistent contributions compounds meaningfully over decades. This guide walks through how to use the calculator effectively, what VTI's dividend history tells us, and how to set realistic expectations for your reinvestment strategy.
How to use a VTI DRIP calculator to project returns
Every dividend reinvestment calculator runs on five core inputs. Get these right and the output becomes genuinely useful for planning.
- Initial investment: Your starting capital in dollars.
- Monthly contribution: Additional capital added each period. This matters more than yield for VTI.
- Time horizon: The number of years you plan to hold. Compounding rewards patience.
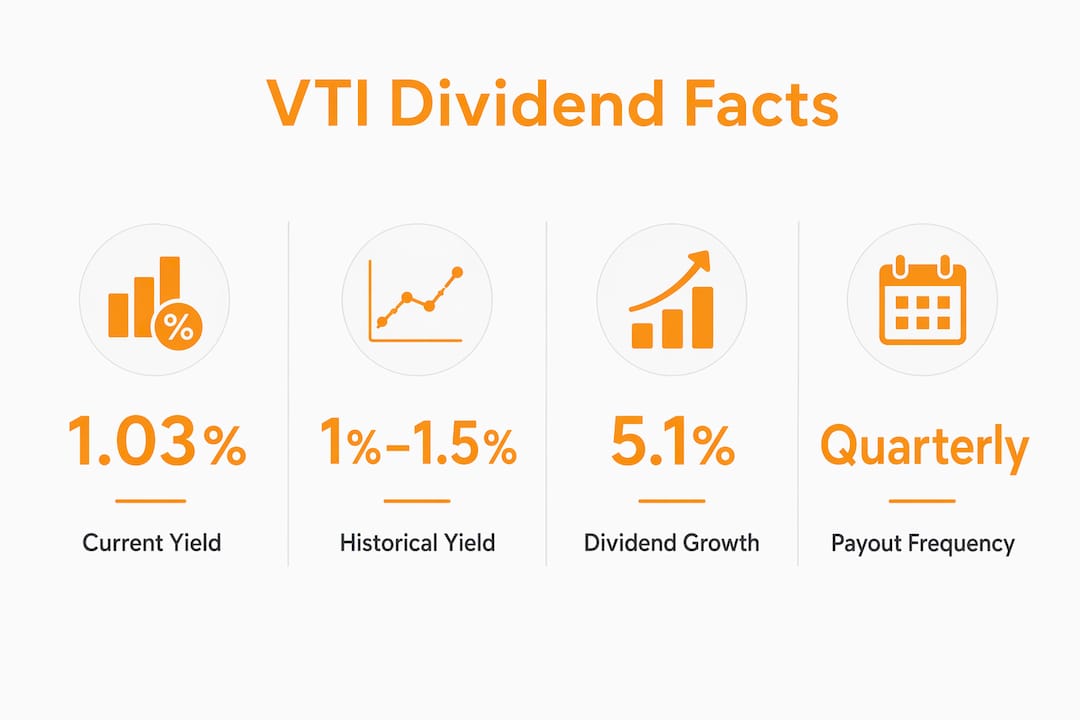
- Dividend yield: Pre-loaded at roughly 1.03% for VTI; override only with a well-reasoned assumption.
- Dividend growth rate: VTI's 5-year CAGR runs about 5.1%, a reasonable baseline for projections.
Once inputs are set, toggle between DRIP on and DRIP off to see the compounding premium. The output typically shows projected annual dividend income, cumulative dividends, share count growth, yield on cost, and total portfolio value. Yield on cost is the metric worth watching over long horizons: it reflects your growing dividend stream against your original cost basis, not today's share price. A position bought today at 1.03% yield can reach a meaningfully higher yield on cost after 15–20 years of reinvestment at historical growth rates.
Pro Tip: Add a realistic monthly contribution to your scenario before comparing DRIP on versus off. For a low-yield fund like VTI, ongoing capital contributions drive more of the long-term result than reinvestment alone.

VTI's dividend history: what the data actually shows

VTI pays dividends quarterly, and its yield has historically ranged between 1% and 1.5%, reflecting the broad US market's heavy weighting toward low-yield technology constituents. That's not a flaw; it's a structural feature of owning the whole market.
| Dividend Date | Dividend per Share | TTM Yield | Share Price |
|---|---|---|---|
| — | — | — | — |
| — | — | — | — |
| — | — | — | — |
| — | — | — | — |
| — | — | — | — |
| — | — | — | — |
| September 27, 2024 | $0.871 | 1.32% | $282.05 |
| June 28, 2024 | $0.952 | 1.37% | $267.51 |
VTI's payout fluctuates because the fund passes through dividends from thousands of underlying holdings. There's no fixed payout ratio the way a single company might maintain one. The dividend stream reflects the aggregate behavior of the entire US equity market, which means short-term cuts by individual constituents barely register at the fund level.
The 5-year dividend CAGR provides the most reliable input for calculator projections. Using short-term yield spikes or troughs as your baseline will distort the output significantly.
What is DRIP and how does it work with VTI?
DRIP stands for Dividend Reinvestment Plan. Instead of receiving quarterly dividend payments as cash, your brokerage automatically uses those funds to purchase additional VTI shares, including fractional shares, at the prevailing market price.
- Automatic share accumulation: Each quarterly distribution buys more shares without any action on your part.
- Fractional share support: Most major brokerages reinvest the full dividend amount, even when it doesn't cover a whole share.
- Quarterly timing: VTI distributes dividends four times per year; reinvestment occurs shortly after each ex-dividend date.
- Compounding yield on cost: As your share count grows, your dollar income per quarter rises even if the per-share dividend stays flat.
- No transaction fees: Brokerage-level DRIP programs typically reinvest at no additional cost.
- Difference from cash dividends: Taking dividends as cash preserves flexibility but breaks the compounding chain entirely.
The compounding effect is gradual with VTI because the starting yield is modest. A $10,000 position generates roughly $25 per quarter in dividends. That buys a fraction of a share each time, but over years the accumulated fractional shares start generating their own dividends, and the snowball builds.
Risks and downsides of DRIP with VTI
DRIP is not a passive path to income. Several real limitations apply, and a good dividend income calculator should prompt you to account for them.
- Fluctuating payouts: VTI's distributions vary each quarter. Calculators that assume a perfectly smooth growth rate will overstate consistency.
- Tax drag in taxable accounts: Reinvested dividends are still taxable income in the year received. You owe tax on dividends you never touched as cash, which reduces the real compounding benefit outside of tax-advantaged accounts like a Roth IRA.
- Low yield limits income potential: DRIP alone in a low-yield fund like VTI rarely builds significant income without substantial ongoing capital contributions.
- Calculator assumptions ignore reality: Most VTI DRIP calculators exclude tax drag, brokerage-specific reinvestment timing, and share price volatility. The output is a projection, not a forecast.
- Growth rate override risk: Manually overriding the dividend growth rate based on recent market noise distorts long-term projections. Stick to the historical 5-year CAGR as your baseline.
- Price appreciation dominates: Most of VTI's total return comes from share price appreciation, not dividends. DRIP automates cost basis accumulation; it doesn't transform VTI into an income vehicle.
Benefits of dividend reinvestment when holding VTI
The case for DRIP with VTI is about discipline and compounding, not income replacement. The dividend snowball effect is real, but it works best when paired with consistent new capital over long periods.
- Automated cost basis accumulation: Every reinvestment purchases shares at the current price, including during market dips, which lowers your average cost basis over time.
- Behavioral discipline: Removing the cash dividend option eliminates the temptation to spend distributions rather than reinvest them.
- Yield on cost growth: Over 15–20 years at historical dividend growth rates, your yield on cost compounds well above the starting 1.03%, even without adding new capital.
- No timing decisions: DRIP removes the need to decide when to reinvest. The process runs automatically each quarter.
- Compounding share count: More shares generate more dividends, which buy more shares. The effect is slow at first and accelerates over decades.
- Works in tax-advantaged accounts: In a Roth IRA or 401(k), DRIP captures the full compounding benefit with no annual tax drag on reinvested distributions.
Pairing DRIP with a wealth accumulation strategy that includes regular monthly contributions is what separates investors who see meaningful results from those who rely on yield alone.
How Evibe complements your VTI DRIP calculations
A DRIP calculator models one scenario in isolation. Real portfolios are messier: prices move, contributions vary, tax situations differ, and VTI sits alongside other assets. That's where portfolio tracking tools close the gap.
- Real-time syncing: Evibe automatically syncs your brokerage accounts, so your actual VTI share count and dividend history stay current without manual entry.
- Dividend tracking: Evibe's dividend tracker captures executed, declared, and estimated payments, giving you a live view of income versus your calculator projections.
- Multi-asset consolidation: VTI rarely sits alone. Evibe consolidates stocks, ETFs, crypto, real estate, and other asset classes into one dashboard so dividend income is viewed in the context of total net worth.
- Benchmark comparisons: Track VTI's performance against major indices to see whether your reinvestment strategy is keeping pace with the broader market.
- AI-driven insights: Evibe's AI analysis flags risk concentration, diversification gaps, and performance trends, adding context that a standalone dividend calculator can't provide.
- Smart alerts: Set alerts for dividend payments, price movements, or portfolio drift so you can adjust contributions or reinvestment assumptions when conditions change.
Pro Tip: Use Evibe's dividend tracker alongside your DRIP calculator to compare projected versus actual dividend income each quarter. Gaps between the two reveal whether your growth rate assumption needs recalibrating.
VTI DRIP calculator scenarios: three investment examples
Numbers make the abstract concrete. These scenarios use a 1.03% starting yield and 5.1% dividend growth rate as the baseline, with DRIP enabled.
Scenario 1: $10,000 invested, no monthly contributions, 10-year horizon After 10 years, the portfolio grows to approximately $11,100 with DRIP versus $11,050 without it. The DRIP bonus is modest at roughly $48, reflecting VTI's low yield. Annual dividend income reaches about $112 by year 10, with yield on cost at 1.12%.
Scenario 2: $10,000 invested, $200 monthly contributions, 10-year horizon Monthly contributions transform the outcome. The ongoing capital additions compound alongside reinvested dividends, producing a portfolio value and income stream that dwarfs the no-contribution scenario. This is the combined effect of contributions and reinvestment that drives real wealth growth in VTI.
Scenario 3: $50,000 invested, no contributions, 20-year horizon Over a 20-year horizon, the yield on cost compounds noticeably above the starting rate as dividend growth accumulates. The gap between DRIP on and DRIP off widens with time, illustrating why long holding periods matter more than starting yield for VTI investors.
The key takeaway across all three: contributions matter more than reinvestment for VTI. Use the calculator to model investment returns across different contribution levels before fixating on yield assumptions.
How dividend reinvestment affects total return over time
VTI's total return story is primarily about price appreciation. The 5-year share price CAGR runs at 10.62% per year, far outpacing the 1.03% dividend yield. Dividends are a side feature of owning the full US equity market, not the primary return driver.
That said, reinvesting dividends does contribute to total return in two ways. First, it compounds the share count, so you own more of the fund's price appreciation over time. Second, it raises your yield on cost, meaning the income your original capital generates grows each year even as the market yield stays flat. A VTI position held for 15–20 years with DRIP enabled can reach a yield on cost several times the starting rate, purely from dividend growth compounding against a fixed cost basis.
The practical implication: don't evaluate VTI's DRIP results against income-focused ETFs using dividend yield alone. VTI's total return, including price appreciation, has historically exceeded yield-tilted alternatives over long periods. A dividend income calculator models only the income component. For VTI specifically, that component is a small fraction of the historical total return, and any honest assessment of the fund's performance requires looking at both.
Key Takeaways
A VTI DRIP calculator is most useful when paired with realistic contribution assumptions, since VTI's 1.03% yield makes ongoing capital the primary driver of long-term wealth growth.
| Point | Details |
|---|---|
| Starting yield is low | VTI's current yield of about 1.03% means $10,000 generates roughly $103 per year before taxes. |
| Contributions drive results | Monthly contributions compound alongside DRIP reinvestment and matter more than yield for VTI wealth building. |
| Yield on cost compounds | At a 5.1% dividend growth rate, yield on cost rises meaningfully over 15–20 years against a fixed cost basis. |
| Calculators exclude tax drag | DRIP projections ignore taxes on reinvested dividends; taxable account holders should factor in this real cost. |
| Price appreciation dominates | VTI's 5-year share price CAGR of 10.62% far exceeds its dividend yield; total return requires both components. |

Evibe brings your VTI holdings, dividend history, and total portfolio into one real-time dashboard. Instead of toggling between a DRIP calculator and your brokerage account, you get live dividend tracking alongside AI-driven insights, smart alerts, and benchmark comparisons, all synced automatically. If you're serious about tracking what your reinvestment strategy is actually delivering versus what the calculator projected, Evibe is built for exactly that.