SCHD Div Calculator: Maximize Your Dividend Income
Use the SCHD div calculator to unlock your dividend potential — estimate income, project long-term growth, and maximize returns with Evibe’s private tracker.
SCHD Div Calculator: Maximize Your Dividend Income

TL;DR:
- A SCHD dividend calculator estimates income and growth based on investment inputs like share count and dividend yield. It helps investors project long-term portfolio value and compare reinvestment scenarios, especially using DRIP. Accurate projections require current dividend data, multiple growth rate scenarios, and consideration of tax effects.
A SCHD div calculator is a tool that estimates dividend income and projected growth from investments in the Schwab U.S. Dividend Equity ETF, based on your share count, yield, and reinvestment settings. Serious dividend investors use it to model quarterly cash flows, project long-term portfolio value, and test how the Dividend Reinvestment Plan (DRIP) compounds returns over time. The key metrics driving every projection are dividend yield, dividend per share, share price, and dividend growth rate. Get these inputs right, and the calculator gives you a reliable income roadmap.
How to calculate SCHD dividends manually and with a calculator
Two manual methods cover most SCHD dividend calculations. The first multiplies your total share count by the annual dividend per share. The second multiplies your total investment value by the current yield. Both arrive at the same number when your inputs are accurate.
SCHD pays quarterly dividends in march, june, september, and december, with a trailing twelve-month dividend per share of approximately $1.01 to $1.06 as of mid-2026. That quarterly schedule means you receive four separate payments per year, not one lump sum.
A practical example shows how the math works:
| Input | Value |
|---|---|
| Initial investment | $10,000 |
| Share price | $31.71 |
| Shares purchased | 315.4 |
| Annual dividend per share | $1.04 |
| Estimated annual dividend income | $328 |
A $10,000 investment at $31.71 per share generates roughly $330 in annual dividends before taxes. That figure assumes no reinvestment and no share price change.
Online SCHD dividend estimator tools automate this process entirely. You enter your investment amount, confirm the current share price, and the calculator fills in yield and dividend data automatically. The real advantage is speed: you can test a dozen scenarios in minutes instead of building your own spreadsheet.
Key benefits of using an automated SCHD investment calculator:
- Instant projection of annual and monthly income
- Built-in DRIP modeling to show compounding effects
- Scenario testing across conservative, base, and optimistic growth rates
- Yield on cost tracking over multi-year periods
Pro Tip: Always cross-check the calculator's pre-filled dividend data against the ETF's current distribution page. Automated tools sometimes lag by one quarter.
What inputs and assumptions drive accurate SCHD projections?
Every SCHD dividend analysis tool is only as good as the inputs you give it. The five core variables are initial investment, current share price, dividend per share, annual yield, and dividend growth rate.

SCHD's dividend growth rate has averaged approximately 9–11% annually over the last decade. That historical range is a reasonable baseline, but using only the optimistic end of that range will inflate your projections. Investors should run at least three scenarios: conservative (around 7%), base (around 9%), and optimistic (around 11%).
Tax treatment is a variable most calculators ignore by default. Qualified dividends are taxed at 15% or 20% depending on your income bracket, which is meaningfully lower than ordinary income rates. SCHD distributions generally qualify, but you should confirm this each year and factor the tax rate into your net income estimate.
Additional inputs worth adjusting:
- Dividend frequency: Quarterly is the default for SCHD
- Periodic contributions: Adding monthly or annual contributions accelerates growth significantly
- Share price growth rate: Some calculators let you model capital appreciation alongside dividend income
- Tax account type: IRA and 401(k) accounts eliminate the quarterly tax drag on reinvested dividends
Pro Tip: If a calculator defaults to trailing twelve-month data, manually input the current dividend rate to avoid distortions from special dividends or recent cuts.
How does DRIP affect your SCHD dividend calculator projections?
DRIP, or Dividend Reinvestment Plan, is the practice of using each quarterly dividend payment to purchase additional SCHD shares instead of taking cash. Those extra shares generate their own dividends the following quarter, creating a compounding cycle.
Reinvesting dividends through DRIP can more than double your final portfolio value and dividend income over 20 years compared to taking dividends as cash. That is not a marginal difference. It is the single most powerful lever in long-term SCHD income planning.
The table below illustrates the projected difference on a $10,000 starting investment over a 20-year period, assuming a 9% dividend growth rate and a 3.2% starting yield:
| Scenario | Projected portfolio value | Projected annual dividends |
|---|---|---|
| No DRIP (cash dividends) | Moderate growth | Flat income growth |
| DRIP enabled | Significantly higher | Compounding income growth |
The catch is tax drag. DRIP reinvestment triggers a taxable event each quarter in taxable brokerage accounts. You owe taxes on dividends even when you reinvest them, which reduces the net compounding effect compared to a tax-advantaged account like a Roth IRA. Calculators with a tax toggle let you model this realistically.
Choosing the right calculator for DRIP analysis matters. Look for tools that show DRIP and non-DRIP projections side by side, and that let you specify whether your account is taxable or tax-advantaged. That single setting can shift your 20-year projection by a meaningful amount.
Pro Tip: Hold SCHD inside a Roth IRA when possible. DRIP in a tax-advantaged account eliminates quarterly tax drag entirely, and your long-term income projections will reflect the full compounding benefit.
Step-by-step guide to using an SCHD dividend calculator
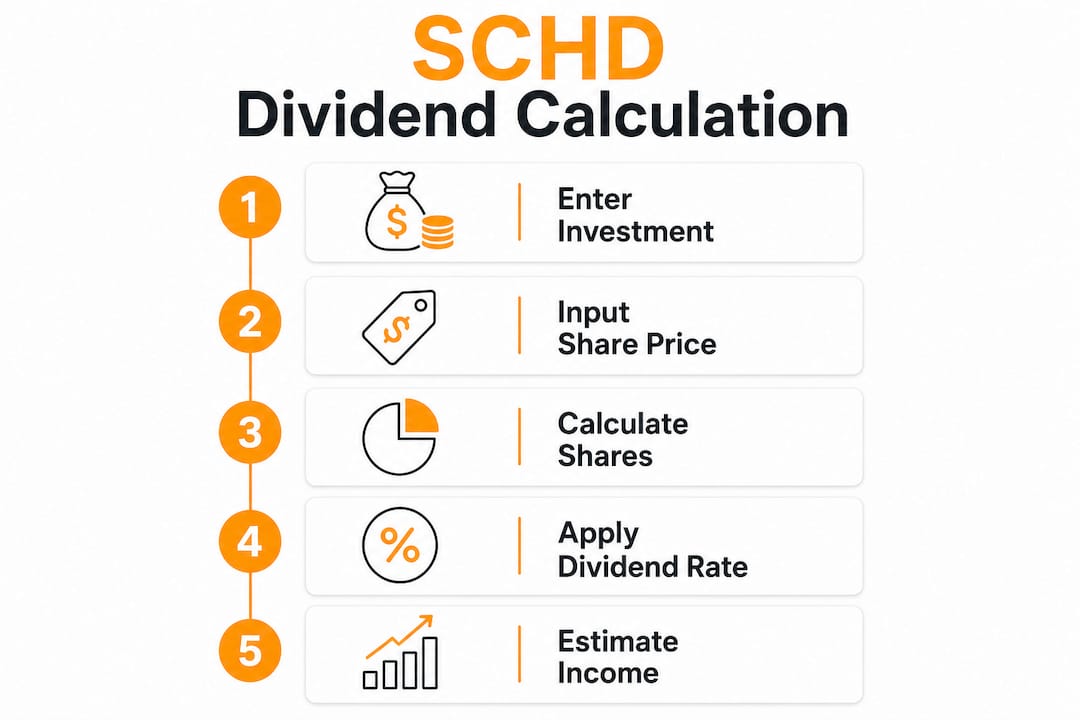
Using a dividend payout calculator for SCHD effectively takes less than five minutes when you follow a clear process.
- Enter your initial investment amount. Use the dollar amount you plan to invest or have already invested.
- Confirm the current share price. Pull the live price from a financial data source, not the calculator's default.
- Verify dividend per share. Check the most recent quarterly distribution and annualize it (multiply by four).
- Set your dividend growth rate. Start with the historical base case of 9% and run a second scenario at 7%.
- Toggle DRIP on and off. Compare both projections to understand the compounding impact.
- Add periodic contributions if supported. Even $100 per month changes the 10-year outcome significantly.
- Review yield on cost. This metric shows what your original investment yields in year 10 or year 20, not just today.
- Adjust for taxes. If your account is taxable, apply the 15% qualified dividend rate to get a realistic net income figure.
The table below summarizes the key features to look for in any SCHD expected returns calculator:
| Feature | Why it matters |
|---|---|
| DRIP toggle | Shows compounding vs. cash-out scenarios |
| Tax account selector | Adjusts for taxable vs. tax-advantaged growth |
| Dividend growth rate input | Lets you test conservative and optimistic cases |
| Yield on cost display | Reveals long-term income power of your entry price |
| Periodic contribution field | Models ongoing investment, not just lump sum |
Interpreting results correctly is as important as entering accurate data. Your stock dividend calculator output is a projection, not a guarantee. SCHD's dividend growth has been consistent, but market conditions, fund composition changes, and interest rate shifts all affect future distributions. Treat the output as a planning range, not a fixed income promise.
A common mistake is anchoring to the optimistic growth scenario. Run the conservative case first. If the conservative projection still meets your income goal, your plan is sound. If it does not, you need to increase your investment amount or extend your timeline.
Key Takeaways
A SCHD dividend calculator is most accurate when you input current dividend data manually, run multiple growth rate scenarios, and account for tax drag on DRIP reinvestment.
| Point | Details |
|---|---|
| Use current dividend data | Override trailing twelve-month defaults with the latest quarterly distribution to avoid projection errors. |
| Run three growth scenarios | Test 7%, 9%, and 11% dividend growth rates to understand the realistic range of outcomes. |
| Model DRIP impact | DRIP can more than double portfolio value over 20 years; always compare it against the cash-out scenario. |
| Account for tax drag | Taxable accounts owe quarterly taxes on reinvested dividends, which reduces net compounding versus a Roth IRA. |
| Track yield on cost | Yield on cost reveals the true long-term income power of your entry price better than current yield alone. |
Why I trust yield on cost more than current yield
Most investors fixate on SCHD's current yield when they first open a dividend estimator. I understand the instinct. Current yield is visible, easy to compare, and feels concrete. The problem is that it tells you nothing about what your investment will actually earn in year 15.
Yield on cost reveals how your original purchase price compounds into a much higher effective yield over time. An investor who bought SCHD at $20 per share and held through a decade of 9–11% annual dividend growth is now earning a yield on cost that dwarfs the current market yield. That is the metric worth watching.
I have also seen investors build projections using only the optimistic growth scenario, then feel blindsided when actual distributions come in lower. The range-based approach is not pessimism. It is the only honest way to plan. Use conservative, base, and optimistic cases together, and your income plan survives market volatility without requiring a full rebuild.
One more thing most calculators skip: fees and real-world friction. SCHD's expense ratio is low, but if you hold it in a taxable account and reinvest every quarter, the cumulative tax drag over 20 years is real money. Run your projections in a tax-advantaged account first. Then model the taxable scenario. The gap between those two outputs is your incentive to use your IRA space before your brokerage account.
— Vincent
Evibe tracks your SCHD dividends in real time
A calculator gives you projections. Evibe gives you the actual numbers as they happen.

Evibe syncs your brokerage accounts automatically and tracks every SCHD dividend payment, declared or executed, alongside your full portfolio. You see your dividend income stream, net worth, and portfolio performance in one place, without manual entry. The Evibe dividend tracker shows executed, declared, and estimated payouts so you always know what is coming next. If you hold SCHD across multiple accounts, including IRAs and taxable accounts, Evibe consolidates everything into a single view. For investors who want their calculator projections grounded in live data, Evibe is the natural next step.
FAQ
What is a SCHD div calculator?
A SCHD div calculator is a tool that estimates dividend income and portfolio growth from investments in the Schwab U.S. Dividend Equity ETF. It uses inputs like share count, yield, and dividend growth rate to project annual income and long-term value.
How often does SCHD pay dividends?
SCHD pays quarterly dividends, typically in march, june, september, and december. The exact payment dates vary each year.
What dividend growth rate should I use in my SCHD calculator?
SCHD's historical dividend growth has averaged approximately 9–11% annually over the last decade. Use a conservative rate of 7% as your baseline and run a second scenario at 9–11% to see the range of possible outcomes.
Does DRIP really make a significant difference in SCHD projections?
Yes. Reinvesting dividends through DRIP can more than double your final portfolio value and annual dividend income over a 20-year period compared to taking dividends as cash. The effect is strongest in tax-advantaged accounts where quarterly tax drag does not apply.
Are SCHD dividends qualified or non-qualified?
SCHD distributions generally qualify as qualified dividends, which are taxed at 15% or 20% depending on your income bracket. Confirm the classification each tax year, as fund composition changes can affect the qualified percentage.