Portfolio Beta for Investors: Excel Formula and 3 Position Example
Practical Excel and regression steps to calculate portfolio beta, interpret results, avoid stale betas and ETF look through pitfalls, and automate updates.
Portfolio Beta for Investors: Excel Formula and 3 Position Example

Portfolio beta measures how sensitive your portfolio's returns are to moves in a benchmark, where the benchmark itself is assigned a value of 1. A beta above 1 means your portfolio tends to swing harder than the market; below 1 means it swings less. We built this explainer because the math is simple once you see it done, and knowing your number changes how you size positions and judge risk.
TL;DR:
- Regularly recalculate your portfolio beta to account for weight shifts, as even small changes can significantly alter your risk profile.
- Use a lookback period of 36 to 60 months for beta data, and verify the specific period when reviewing published figures, since different windows can produce different results.
- Be cautious when relying on fund-level betas for ETFs; analyzing individual holdings provides a more accurate picture of your actual market exposure.
- Aim for a portfolio beta that matches your risk tolerance, adjusting your allocations or hedges if your current beta drifts more than 5 percent from your target.
- Rechecking beta at least quarterly, especially after major trades or market moves, helps prevent unnoticed risk drift and keeps your risk management effective.
Table of Contents
- Portfolio Beta Explained: What It Measures and Why the Benchmark Matters
- How to Calculate Portfolio Beta: Formula and Step-by-Step Method
- A Worked Example: Calculating Portfolio Beta for Three Positions
- Interpreting Portfolio Beta: What the Number Actually Tells You
- Where to Find Reliable Beta Data and When to Calculate Your Own
- Limitations and Common Beta Mistakes Investors Make
- Using Portfolio Beta to Set Targets and Guide Rebalancing
- Why Professionals Treat Beta as a Moving Target
- Keep Your Portfolio Beta Current Without the Spreadsheet Work
- Sources
Portfolio Beta Explained: What It Measures and Why the Benchmark Matters
Beta captures systematic risk, the portion of a portfolio's movement tied to the broader market rather than to company-specific events. It's a single number that answers a specific question: when the benchmark moves 1%, how much does your portfolio typically move? That's it. It doesn't tell you about earnings surprises, management changes, or sector-specific shocks. Those fall under unsystematic risk, and beta was never designed to capture them.
Your benchmark choice changes the answer. Most US equity portfolios get measured against the S&P 500, but a small-cap fund measured against that index will often show a distorted beta because the two don't move together cleanly. That's where R-squared comes in. It tells you how much of your portfolio's movement the benchmark actually explains. A low R-squared means beta is a weak predictor for that asset against your chosen benchmark, and the number becomes close to meaningless.
A few things to keep in mind before you start calculating:
- Beta is backward-looking. It's calculated from historical returns, so it reflects how a stock behaved, not how it will behave.
- The lookback period changes the result. A three-year beta and a five-year beta on the same stock can differ meaningfully.
- Beta only makes sense paired with a benchmark that actually correlates with the holding.
- No single number substitutes for understanding what's actually driving your risk.
How to Calculate Portfolio Beta: Formula and Step-by-Step Method
The formula is one line: Portfolio Beta = Σ(weight_i × beta_i). You multiply each holding's weight by its individual beta, then add up the results. No calculus, no black box. Here's how to run it on your own holdings.
- List every position and its current market value. Pull today's prices, not your cost basis. Beta cares about what the position is worth right now.
- Calculate each position's weight. Divide each holding's market value by the total portfolio value. Weights should sum to 1 (or 100%) across everything you own.
- Find or calculate each holding's beta. Most brokerage platforms and financial data sites publish beta for individual stocks and funds. If you want a custom number, you can compute beta yourself using covariance of the asset's returns and the market's returns, divided by the market's variance, run as a regression over historical return data.
- Multiply each weight by its corresponding beta. This gives you each position's beta contribution.
- Sum the contributions. That total is your portfolio beta.
In a spreadsheet, this maps cleanly to a handful of columns: market value, weight (market value divided by portfolio total), individual beta, and weighted beta (weight times beta). A SUMPRODUCT formula across the weight and beta columns will do the whole calculation in one cell once your data is populated. If you're pulling betas manually from a broker's research tab, double check the lookback period listed. Some platforms default to 60 months, others to 36, and the number shifts depending on which you're looking at.
Regression-based beta requires a bit more legwork. You need a return series for both the asset and the benchmark over the same period, then you calculate covariance and variance, or run a simple linear regression with the benchmark as the independent variable. Most spreadsheet programs have built-in functions for both covariance and variance, so once you have the return data lined up, the calculation itself takes seconds. The harder part is sourcing clean return data, especially for less common holdings.
A Worked Example: Calculating Portfolio Beta for Three Positions
Numbers make this concrete. Say you hold three positions:
- Stock A: $30,000 market value, beta of 1.4
- Stock B: $50,000 market value, beta of 0.8
- Bond Fund C: $20,000 market value, beta of 0.2
Total portfolio value: $100,000. Your weights are 30%, 50%, and 20%.
Multiply each weight by its beta: Stock A contributes 0.30 × 1.4 = 0.42. Stock B contributes 0.50 × 0.8 = 0.40. Bond Fund C contributes 0.20 × 0.2 = 0.04.
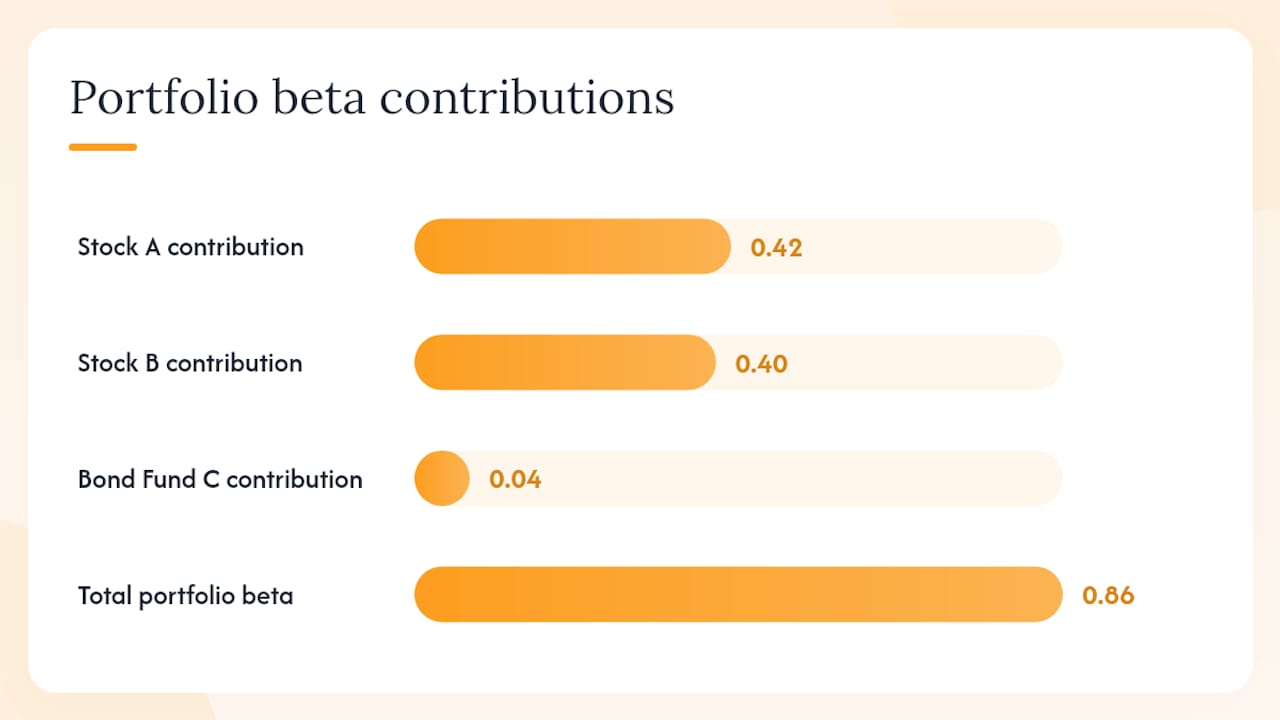
Your portfolio beta is 0.42 + 0.40 + 0.04 = 0.86.
That number sits below 1, meaning this portfolio has historically moved a bit less than the benchmark.
Replicating this in a spreadsheet or a dividend and holdings tracker takes the same four columns from the calculation section: market value, weight, beta, and weighted contribution. The moment you add a fourth position or sell out of one, every weight shifts, and so does your portfolio beta, which is exactly why this isn't a set-it-and-forget-it number.
Interpreting Portfolio Beta: What the Number Actually Tells You
A beta of exactly 1 means your portfolio has historically moved in step with the benchmark. Nothing amplified, nothing dampened. Most broad index funds sit close to this mark by design.
Here's how to read the ranges you'll actually encounter:
- Beta greater than 1: The portfolio has amplified benchmark moves. A beta of 1.3 suggests roughly 13% movement for every 10% the benchmark moves, in either direction.
- Beta between 0 and 1: The portfolio moves in the same direction as the benchmark, but with less force. Utility-heavy or bond-heavy portfolios often land here.
- Beta near 0: Little to no historical relationship with benchmark moves. Cash and some market-neutral strategies fall in this range.
- Negative beta: The portfolio has tended to move opposite the benchmark. Gold miners and certain volatility-linked instruments have shown negative beta during specific periods, though this relationship is rarely stable.
Whether a given beta is "good" depends entirely on what you're trying to accomplish. A retiree drawing down income might target a beta well under 1 to reduce swings in a portfolio they can't afford to watch drop 20% in a bad quarter. A younger investor with decades to recover from drawdowns might deliberately run beta above 1, accepting sharper dips for a shot at outsized gains in strong markets. Neither approach is objectively right. Beta is a tool for matching your portfolio's behavior to your own tolerance and timeline, not a scorecard with a passing grade.
Where to Find Reliable Beta Data and When to Calculate Your Own
Most brokerage platforms and financial data providers publish beta figures directly on a stock or fund's research page, and for a quick check, that's usually good enough. The trouble starts when you rely on those published numbers without checking their assumptions.
- Published betas vary by lookback window. A provider using a 60-month window and one using a 36-month window can show different numbers for the same stock.
- Betas on data platforms update periodically, not continuously, so a number you pulled six months ago may already be stale.
- For a fund or ETF holding dozens of underlying names, you often need to look through to those holdings for an accurate current beta rather than trusting the fund's own published figure.
- If you want a beta calculated on your own timeframe, running a regression on historical return data gives you full control, though it takes more setup.
Pro Tip: When you check a published beta, look for the disclosed lookback period before you use the number. A 36 month beta and a 60 month beta on the same stock can differ enough to change how you'd read your whole portfolio's risk.
Limitations and Common Beta Mistakes Investors Make
Beta is useful, but it's easy to misuse. A few traps come up constantly, even among investors who understand the formula perfectly well.
- Treating a fund's published beta as accurate without looking through its holdings. A multi-asset ETF's fund-level beta can mask very different exposures underneath.
- Ignoring leverage and derivatives. Options and leveraged positions can shift your real market exposure well beyond what a simple weighted average suggests.
- Letting allocation drift go unmeasured. As positions grow or shrink in value, their weights change, and your portfolio beta changes with them, even if you never place a trade.
- Trusting beta on a holding with low R-squared. If the benchmark barely explains that asset's movement, the beta number is close to noise.
Pro Tip: Recalculate portfolio beta any time a single position's weight shifts more than a few percentage points from where it started. Drift is silent, and it compounds faster than most investors expect.
Using Portfolio Beta to Set Targets and Guide Rebalancing
Beta becomes genuinely useful once you turn it from a static fact into a working target.
- Set a target beta that matches your risk tolerance. If you want market-like risk, aim close to 1. If you want smoother returns, target below 1 and accept the tradeoff in upside during strong markets.
- Check your actual portfolio beta on a regular cadence. Monthly or quarterly works for most individual investors; more active traders may want it weekly.
- Set a drift threshold that triggers action. A common rule is to rebalance once any position's weight has drifted more than 5% from its target, since that's usually enough to meaningfully shift portfolio beta.
- Rebalance by trimming high-beta winners or adding to low-beta holdings, rather than only buying more of what's already run up.
- Consider simple hedges like adding a small allocation to bonds or a low-beta sector if you need to bring the number down quickly without a full portfolio overhaul.
Why Professionals Treat Beta as a Moving Target
Most retail investors calculate beta once and treat it like a fixed fact. Professionals don't. They know that every price move changes weights, every weight change shifts portfolio beta, and a number calculated in January can be meaningfully wrong by summer if a handful of positions ran hard.
The bigger gap isn't in the math, it's in the habit of rechecking it. A portfolio built to run at 0.9 beta can drift to 1.2 within two quarters if a few high-beta names simply outperform everything else you hold, with no trades required to cause the shift. That's the part conventional explainers skip. Beta isn't a label you calculate once and forget. It's a snapshot that expires the moment your weights move, and weights move constantly. Investors who check their number quarterly, at minimum, catch drift before it becomes a surprise. Those who calculate it once during a research phase and never revisit it are often running a very different risk profile than they think, sometimes for years. For a deeper look at how beta relates to alpha and other risk metrics, our breakdown of alpha versus beta is worth the extra ten minutes.
— Vincent
Keep Your Portfolio Beta Current Without the Spreadsheet Work
Recalculating portfolio beta by hand works fine for a snapshot, but it goes stale the moment a position moves. Evibe syncs your brokerage accounts automatically and recalculates your portfolio's risk profile as your weights shift, including look-through analytics on ETFs so a fund's underlying holdings, not just its published fund-level number, feed into your real exposure.

The app benchmarks your holdings against major indices in real time and sends smart alerts when your risk profile drifts from where you set it, which solves the exact problem this article walked through: beta that's accurate on the day you calculate it and wrong three months later. If your portfolio includes ETFs, the ETF portfolio tracker handles the look-through math automatically instead of asking you to unpack fund holdings by hand. Download Evibe and connect your accounts to see your current portfolio beta without opening a single spreadsheet.
Sources
These sources back the core claims in this piece and are worth reading directly if you want to go deeper on the math:
- Finra
- Portfolio Beta | Formula + Calculator
- What Beta Means for Investors | Investopedia
- Portfolio beta weighting: What it is, why it matters, and how to use | Britannica
This article is general information, not a substitute for advice from a qualified financial advisor. Consult a qualified financial professional about your own circumstances before acting on anything here.