Investors: Max Drawdown Explained, Formula, Example, 4 Step Checklist
Compute max drawdown step by step, see a worked example, and follow a 4 step checklist focused on magnitude and recovery time to set smarter portfolio rules.
Investors: Max Drawdown Explained, Formula, Example, 4 Step Checklist
Maximum drawdown (MDD) is the largest peak-to-trough percentage decline a portfolio has experienced before hitting a new high. Expressed as a single percent, it tells you the worst loss an investor would have actually lived through, and how big a gain is needed just to break even again. For most investors, this number matters more than volatility, because it's the figure most likely to trigger panic selling or prove a portfolio can survive a real crisis.
TL;DR:
- Max drawdown can be significantly affected by the order of returns, with the same annual gains potentially resulting in very different maximum declines.
- Calculating maximum drawdown requires identifying the largest drop from a portfolio's peak to its trough, based on a chosen data window, and tracking recovery time separately.
- In practice, it is essential to always compare total-return data when evaluating drawdowns across funds, as dividends help cushion declines and skew risk assessments.
- It is crucial to monitor both the depth and duration of drawdowns, since quick recoveries like the COVID crash can differ vastly from prolonged downturns in impact on investor behavior.
- Portfolio risk tools, including apps and AI analysis, are increasingly capable of aggregating drawdown metrics across multiple assets to better understand overall risk exposure.
Table of Contents
- What Max Drawdown Measures: Definition and Key Properties
- The Max Drawdown Formula and How to Calculate It
- A Worked Example: Finding Peak, Trough, and Recovery
- Why Recovery Time Matters as Much as the Percentage
- Max Drawdown vs. Volatility, VaR, and Calmar Ratio
- How to Calculate Max Drawdown in a Spreadsheet or Python
- Turning Max Drawdown Into Portfolio Rules
- How Evibe Surfaces Drawdown Across Your Whole Portfolio
- The Case for Watching Drawdown, Not Just Returns
- Sources
- FAQ
What Max Drawdown Measures: Definition and Key Properties
Formally, maximum drawdown is the biggest drop from any peak in an equity curve to the lowest point before that peak is exceeded again. Some analysts express it as a negative number (-35%), others as a positive magnitude (35%). Neither is wrong. Just be consistent when comparing strategies.
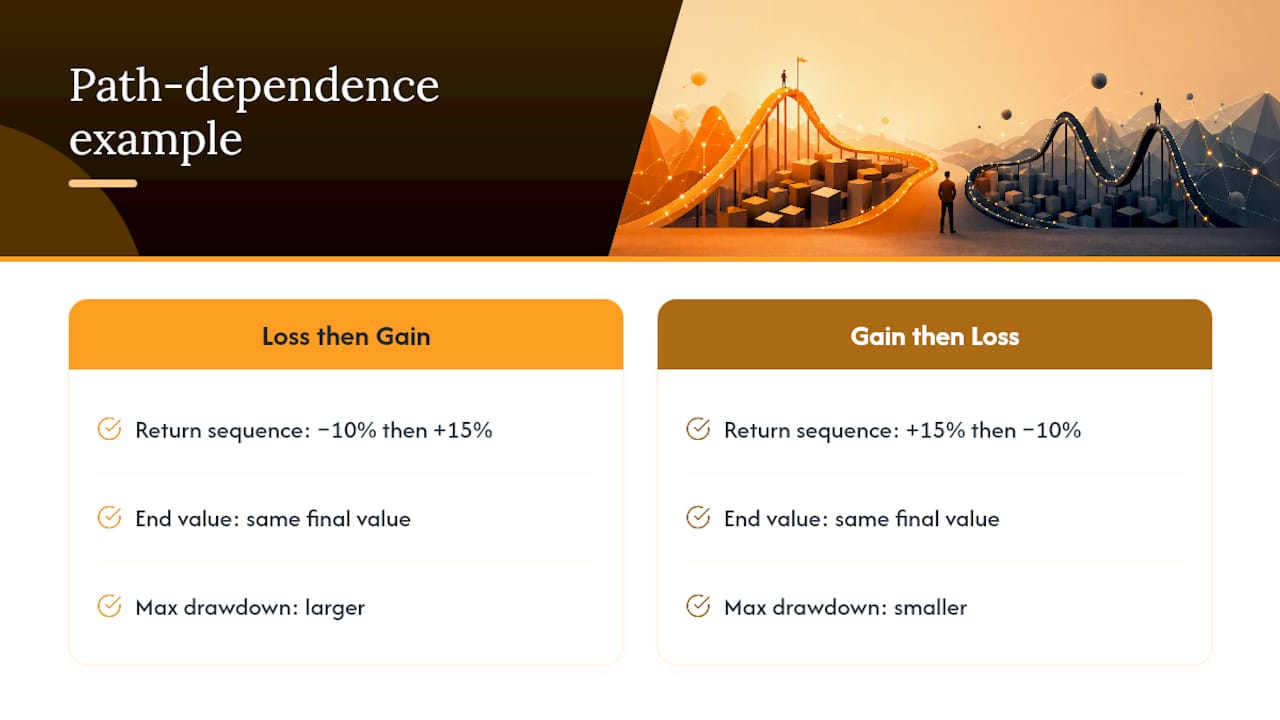
MDD is path dependent, which is its most underrated property. Two portfolios can post identical annual returns and end at the same value, yet have wildly different drawdowns depending on the order those returns occurred in. A 10% loss followed by a 15% gain produces a very different equity curve than the reverse sequence, even though the average return looks the same.
Reporting choices change the number too. A three-year lookback window will almost never show the same MDD as a fifteen-year window. Total-return data (which includes reinvested dividends) typically produces a smaller drawdown than price-only data, since dividends cushion the decline. Maximum drawdown calculated from daily prices also tends to run deeper than the same series sampled monthly, because daily data captures intraday and short-term spikes that monthly snapshots smooth over.
The Max Drawdown Formula and How to Calculate It
The canonical formula is:
MDD = min[(V_t − Peak_t) / Peak_t]
Where V_t is the portfolio's value at time t, and Peak_t is the running maximum value reached up to that point. You're looking for the single largest negative gap between where the portfolio was and where it fell to before recovering.
The calculation runs in four steps:
- Build the equity curve. List portfolio value at each time interval, whether daily, weekly, or monthly.
- Compute the running maximum. At each point, record the highest value reached so far, not just the most recent peak.
- Calculate the drawdown series. At every time step, subtract the running max from the current value and divide by the running max.
- Find the minimum value in that drawdown series. That single most negative number is your max drawdown.
One edge case trips people up constantly: an ongoing drawdown that hasn't recovered yet. If your portfolio is currently sitting 18% below its last peak and hasn't made a new high, that -18% is still your current max drawdown, even though the trough might get worse before it gets better. Report it as "max drawdown to date, ongoing" rather than a final figure. This stepwise process applies whether you're evaluating a single stock, a fund, or an entire multi-asset portfolio.
A Worked Example: Finding Peak, Trough, and Recovery
Picture a portfolio with these month-end values: $100,000 → $112,000 → $105,000 → $95,000 → $98,000 → $118,000 → $104,000.
Walking through the running maximum and drawdown at each step:
- Month 1: $100,000. Running max = $100,000. Drawdown = 0%.
- Month 2: $112,000 (new peak). Running max = $112,000. Drawdown = 0%.
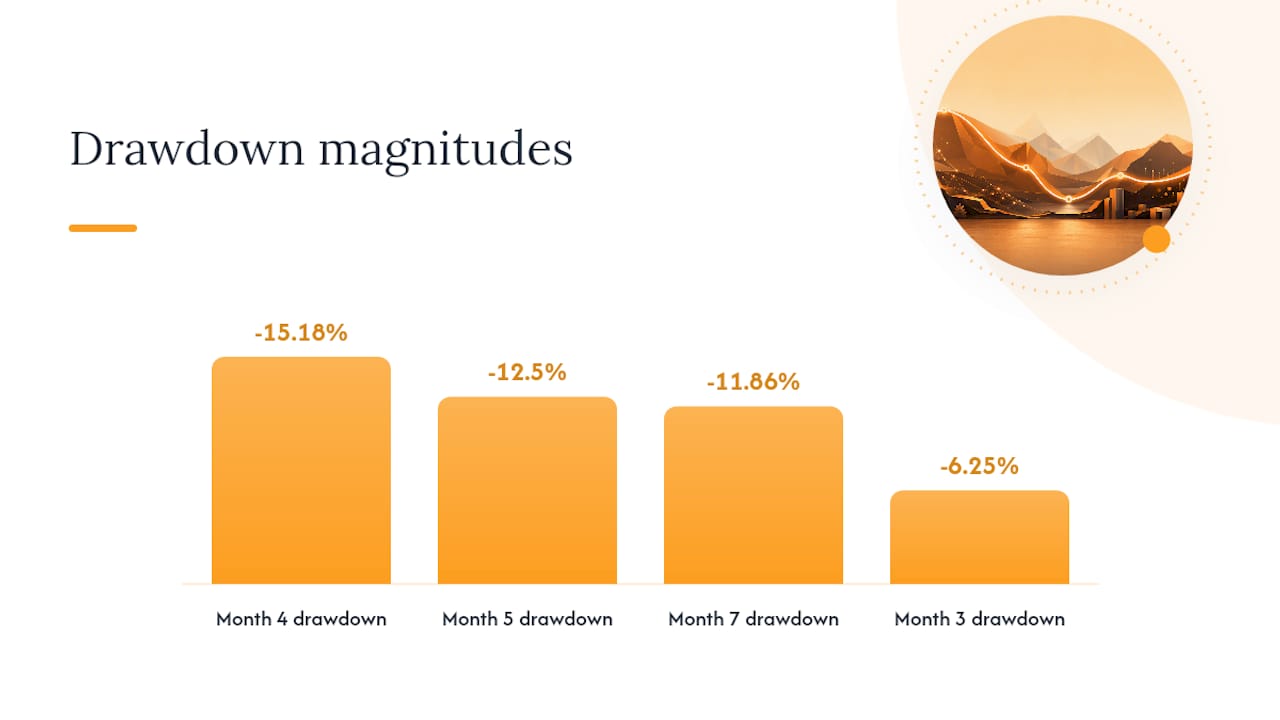
- Month 3: $105,000. Running max stays $112,000. Drawdown = ($105,000 − $112,000) / $112,000 = −6.25%.
- Month 4: $95,000. Running max stays $112,000. Drawdown = −15.18%.
- Month 5: $98,000. Running max stays $112,000 (this interim bounce doesn't set a new high). Drawdown = −12.5%.
- Month 6: $118,000 (new peak, exceeding the old $112,000 high). Running max resets to $118,000. Drawdown = 0%.
- Month 7: $104,000. Running max stays $118,000. Drawdown = −11.86%.
To climb back from $95,000 to the prior peak of $112,000, the portfolio needed a gain of roughly 17.9%, a useful reminder that losses and the recovery gains needed to erase them are never symmetric. Notice that Month 5's bounce to $98,000 doesn't reset anything, because it never exceeded the $112,000 peak that came before it.
Why Recovery Time Matters as Much as the Percentage
A drawdown has three distinct phases worth tracking separately: the peak-to-trough decline, the trough-to-recovery climb back to the old high, and the total time spent "underwater" below that peak.
There's a statistical wrinkle here too. For return series that behave like a random walk, expected maximum drawdown tends to grow with the square root of the observation period, so a strategy tracked for fifteen years will almost mechanically show a deeper MDD than the same strategy tracked for three, even if nothing about its underlying risk changed.
History shows the recovery-speed gap clearly. The S&P 500's roughly -33.9% COVID crash in 2020 recovered in months. Same asset class, wildly different investor experience. Always check both the depth of a drawdown and how long the recovery actually took.
Max Drawdown vs. Volatility, VaR, and Calmar Ratio
Volatility measures dispersion around an average, treating a sharp rally and a sharp crash as equally "risky." Most investors don't feel that way.
Value at Risk (VaR) estimates a loss threshold at a given confidence level over a set horizon, but it's a probabilistic quantile, not a lived outcome. MDD, by contrast, reports what actually happened.
This is where the Calmar ratio earns its place on a factsheet: it divides annualized return by max drawdown, giving a drawdown-adjusted performance number that resonates with investors more directly than Sharpe ratio does. For portfolios prone to occasional severe losses rather than steady daily swings, Conditional Drawdown at Risk (CDaR) goes a step further, averaging the worst tail of drawdowns instead of isolating just the single deepest one.
How to Calculate Max Drawdown in a Spreadsheet or Python
You don't need specialized software to compute this yourself. In a spreadsheet:
- Column A: dates. Column B: portfolio value at each date.
- Column C: running maximum, using a formula like
=MAX($B$2:B2)dragged down the column. - Column D: drawdown, calculated as
=(B2-C2)/C2. - Use
MIN(D:D)to pull the max drawdown, thenINDEX/MATCHto find the exact date it occurred.
In Python with pandas, the same logic takes three lines: compute a running max with .cummax(), subtract and divide to get the drawdown column, then call .min() to extract the worst value. Online calculators are a fast way to sanity check your spreadsheet math on a small series.
Pro Tip: Always calculate max drawdown on total-return data (dividends reinvested) when comparing two funds head to head. Comparing one fund's price-only drawdown against another's total-return drawdown will make the dividend payer look artificially riskier than it is.
Turning Max Drawdown Into Portfolio Rules
Pull max drawdown and its recovery time from the same lookback window and the same data type every time. Mixing a five-year price-only MDD for one holding against a ten-year total-return MDD for another produces a comparison that means nothing.
Pair the raw figure with the Calmar ratio for context, and where possible, run a Monte Carlo simulation of future return paths to see the range of drawdowns the strategy could plausibly produce next. Whenever you quote MDD to someone else, state the dates, the sampling frequency, and whether it's price or total return.
How Evibe Surfaces Drawdown Across Your Whole Portfolio
Calculating max drawdown by hand on one fund is manageable. Doing it across a portfolio spanning stocks, ETFs, options, crypto, and real estate is a different problem entirely, since each account lives in a separate login with its own data format.
Some portfolio apps consolidate holdings automatically once linked, then expose drawdown and recovery metrics at both the individual holding and the whole-portfolio level. AI-driven analysis may help translate a raw drawdown number into context, flagging whether a decline looks typical for that asset class or unusually severe, without requiring you to build a spreadsheet every time markets get rough. For readers who want to go deeper into the underlying math, Evibe's portfolio risk formula guide walks through related risk calculations step by step, and the dividend tracker shows how reinvested payouts factor into total-return figures.
The Case for Watching Drawdown, Not Just Returns
Most investors obsess over returns and treat drawdown as an afterthought, but behaviorally it's backwards. People abandon strategies mid-drawdown, when the number on screen is deep red and recovery feels uncertain. Understanding your portfolio's historical worst-case decline, and honestly asking whether you could sit through it again, does more for long-term discipline than chasing an extra point of return ever will.
Track max drawdown alongside your returns, not after them. If you only look at performance when things are going well, the first real drawdown will catch you unprepared.
— Vincent
Sources
- Maximum Drawdown (MDD) | Investopedia
- Maximum drawdown: the risk metric investors fear most | QuantDecoded
This article is general information, not a substitute for advice from a qualified financial advisor. Consult a qualified financial professional about your own circumstances before acting on anything here.
FAQ
What Is a Good Max Drawdown?
There's no universal number, but many diversified equity portfolios historically see moderate drawdowns during normal market stress, while concentrated or leveraged strategies can see far more. What counts as "good" depends on your time horizon and how much decline you can tolerate without selling.
What Has the S&P 500's Maximum Drawdown Been Historically?
The S&P 500 fell roughly 33.9% during the 2020 COVID crash and recovered within months, while the 2007 to 2009 financial crisis produced a much deeper drawdown that took years to fully recover.
What Happens if I Hit Max Drawdown on a Funded Trading Account?
Funded trading accounts typically set a max drawdown limit as a hard risk rule. Breaching it usually triggers an automatic account suspension or termination, since the metric is used by the firm to cap its own downside exposure to that trader.
Is a 20% Drawdown Bad?
Whether it's "bad" depends more on how long recovery takes and whether it matches your personal risk tolerance than on the number alone.