Distribution Yield Calculator: Formula, Cautions, and Tools
Learn how to use a distribution yield calculator effectively: discover the formula, key cautions, and tools to assess your investment returns accurately.
Distribution Yield Calculator: Formula, Cautions, and Tools

How to calculate distribution yield accurately
A distribution yield calculator measures the annual income return of an investment by annualizing its most recent cash payout and dividing by the current market price or net asset value (NAV). For income-focused investors, this is the starting metric — not the ending one.
The standard formula is:
Distribution Yield = (Most Recent Distribution × Annual Payment Frequency) ÷ Price or NAV × 100

Payment frequency is simply how many times per year the fund distributes: 12 for monthly, 4 for quarterly, 2 for semi-annual, 1 for annual. Getting that multiplier wrong is the most common calculation error.
Two worked examples:
- A REIT priced at $50 pays $0.75 quarterly. Annualized distribution: $0.75 × 4 = $3.00. Yield: ($3.00 ÷ $50) × 100 results in a notable yield percentage
- A bond ETF priced at $25 pays $0.10 monthly. Annualized distribution: $0.10 × 12 = $1.20. Yield: ($1.20 ÷ $25) × 100 results in a moderate yield percentage
A few things to keep straight before you run any numbers:
- Use the NAV at the time the distribution was paid, not today's NAV, when calculating the NAV-based version
- Confirm whether the payout you're using is a regular distribution or a special one-time payment
- Express the result as a percentage, not a decimal
- The yield calculation tool you use must handle frequency conversion correctly — a quarterly payout is not the same as an annual one divided by four in every fund structure
Table of Contents
- Choosing between price-based and NAV-based yield calculations
- Key cautions when interpreting distribution yield
- How Evibe extends distribution yield into a full income analysis
- Distribution yield calculators work best with the right context
- Key Takeaways
- Why distribution yield calculators tell only half the story
- Evibe gives income investors the full picture, not just the headline yield
Choosing between price-based and NAV-based yield calculations
Both approaches use the same numerator. The denominator is what changes, and that choice has real consequences.
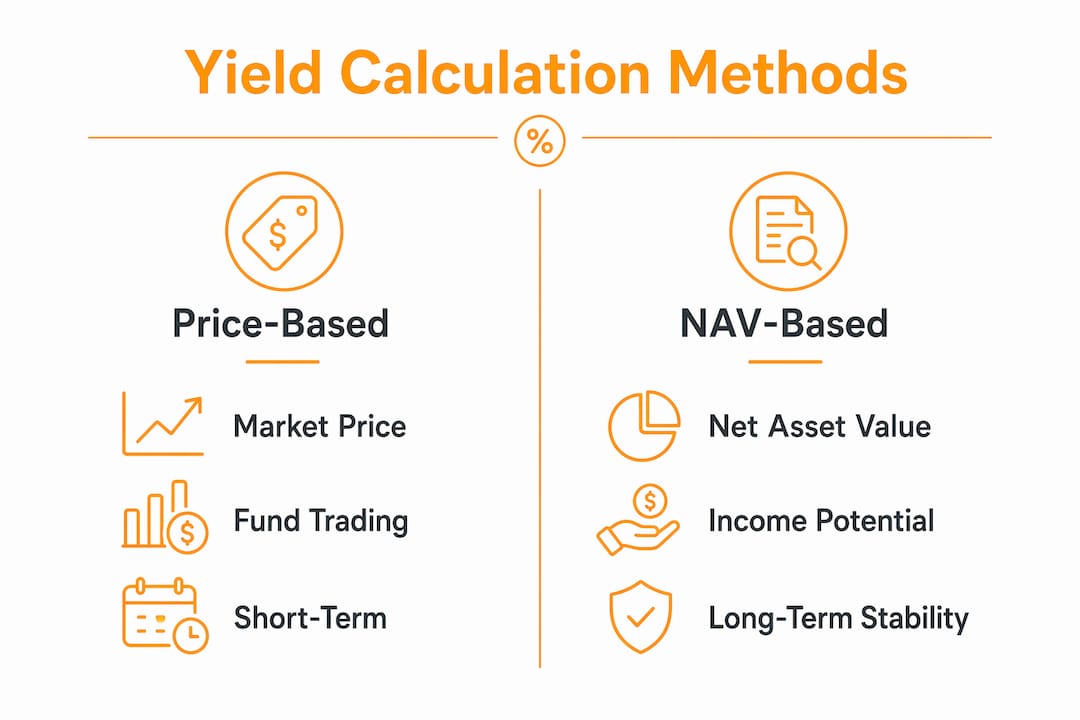
| Method | Denominator | Best used when |
|---|---|---|
| Price-based yield | Current market price per share | Fund trades at or near NAV; you want to know your actual cash-on-cash return |
| NAV-based yield | Net asset value per share | Comparing funds on equal footing; fund trades at a persistent premium or discount |
Price-based and NAV-based yields diverge whenever a fund trades away from its NAV. A closed-end fund at a 10% premium to NAV will show a lower price-based yield than its NAV-based yield, because you are paying more per dollar of underlying assets. The reverse is true at a discount.
Practical guidance:
- For ETFs that trade close to NAV, the difference is usually negligible
- For closed-end funds or interval funds with persistent premiums or discounts, check both figures before drawing conclusions
- Price-based yield reflects what you actually pay; NAV-based yield reflects what the fund's assets are generating
- Neither is "correct" in isolation — they answer different questions
If you are comparing two funds for income potential, NAV-based yield puts them on a level playing field. If you are calculating your personal cash-on-cash return, price-based yield is the right number.
Key cautions when interpreting distribution yield
Distribution yield is a useful snapshot, but it can mislead in several specific ways. Here are the most important ones.
1. High yields often signal risk, not opportunity
A yield above 6–7% frequently reflects market skepticism rather than exceptional income. The price may have dropped sharply, mechanically inflating the yield. Sustainable yields for dividend-focused ETFs are usually moderate and not excessively high. Financial analysts treat anything well above that range as a prompt to investigate, not a reason to buy.
2. Special dividends distort the calculation
Special dividends and capital gains distributions can make a fund's yield look artificially high for one period. If you annualize a quarter that included a one-time capital gains payout, the resulting figure has no predictive value for future income.
3. Use trailing 12-month distributions for stability
Relying on a single distribution to project annual income is unreliable. Summing the actual distributions paid over the trailing 12 months and dividing by current NAV produces a more stable, representative yield figure. This is the approach the Corporate Finance Institute recommends for avoiding distortions from irregular payouts.
4. Distribution yield ignores total return
A fund can pay a 10% distribution yield while its NAV erodes at 8% annually. The net result is a 2% real gain, not 10%. Distribution yield alone tells you nothing about price appreciation or depreciation — which is why income investors who track only this metric sometimes find their portfolio shrinking in real terms.
5. Compare it to SEC yield for fixed-income funds
The SEC yield uses a standardized 30-day formula that accounts for fund expenses and is required disclosure for mutual funds and ETFs. For bond funds, it is often a better predictor of future income than distribution yield. The trailing 12-month distribution yield is usually the more stable input for equity dividend funds, where the difference from SEC yield is typically under 0.3 percentage points.
6. Yield to maturity is a different metric entirely
Yield to maturity (YTM) applies to individual bonds and accounts for coupon payments, par value, current price, and time to maturity. It is not interchangeable with distribution yield. If you are using a bond price and yield calculator to evaluate fixed-income holdings, YTM is the relevant figure; distribution yield applies to funds and income-paying securities with ongoing payouts.
7. Taxes reduce what you actually keep
Distributions are taxed differently depending on their character. Qualified dividends face lower rates than ordinary income; return-of-capital distributions are not immediately taxable but reduce your cost basis, affecting future capital gains. Your after-tax yield can differ substantially from the headline figure, particularly in taxable accounts. Always factor in your marginal rate and the distribution's tax classification before comparing yields across investment types. Understanding investment risk in this context means accounting for tax drag as a real cost.
How Evibe extends distribution yield into a full income analysis
Running a distribution yield calculation manually gives you a number. What it does not give you is context, trend data, or an alert when something changes. That is where Evibe's portfolio tracking capabilities become relevant for income-focused investors.
Evibe consolidates stocks, ETFs, REITs, crypto, and other asset classes into a single dashboard with automatic account syncing. For distribution yield analysis specifically, the app tracks:
- Dividend and distribution history across all holdings, including paid, declared, and estimated amounts
- Yield on cost, calculated against your original purchase price rather than today's market price — a metric that rewards long-term holders as distributions grow while the cost basis stays fixed
- Real yield, which adjusts distribution yield by NAV changes over the same period to reveal whether distributions represent genuine earnings or a return of invested capital
- Benchmarking against major indices, so you can see whether your income portfolio is keeping pace with broader market returns
- Smart alerts for distribution changes, NAV movements, and portfolio drift
Pro Tip: Use Evibe's real yield tracking to catch NAV erosion early. A fund showing a 9% distribution yield while its NAV declines 5% annually is delivering a real yield closer to 4% — and Evibe surfaces that gap automatically rather than leaving you to calculate it manually each quarter.
For analysts managing multiple income positions, Evibe's yield on cost view and dividend tracker make it straightforward to see which holdings are compounding income effectively and which are masking capital erosion behind a high headline yield. The app also connects to AI assistants like ChatGPT, Claude, and Gemini via API, letting you query your portfolio data directly.
Distribution yield calculators work best with the right context
The formula is simple. The interpretation is where most investors go wrong.
- Always use the correct frequency multiplier — monthly, quarterly, or annual — before dividing by price or NAV
- Choose your denominator deliberately: price-based for personal cash-on-cost return, NAV-based for fund comparisons
- Default to trailing 12-month distributions rather than a single recent payout to avoid distortion from special dividends
- Never evaluate distribution yield without checking total return; a high yield on a declining NAV is not income, it is capital return
- Compare against SEC yield for bond funds; use yield to maturity for individual bond analysis
- Account for tax character before comparing yields across account types
- Use an ETF dividend calculator or integrated tracking tool to monitor how yield figures shift as prices and distributions change over time
Key Takeaways
Distribution yield is only as reliable as the inputs and context behind it — trailing 12-month distributions, the right denominator, and a total return check are non-negotiable for accurate income analysis.
| Point | Details |
|---|---|
| Core formula | Annualize the most recent distribution by payment frequency, then divide by price or NAV and multiply by 100. |
| Denominator choice | Use price-based yield for personal cash-on-cost; use NAV-based yield when comparing funds on equal footing. |
| High yield caution | Yields above 6–7% often signal risk; sustainable ranges for dividend-focused ETFs run around 2.5–4%. |
| Trailing 12-month method | Summing actual distributions over the past year avoids distortion from special or one-time payouts. |
| Evibe for income analysis | Evibe tracks real yield, yield on cost, and distribution history across all holdings, surfacing NAV erosion that headline yield figures hide. |
Why distribution yield calculators tell only half the story
The conventional wisdom is that a higher distribution yield means a better income investment. That framing is wrong often enough to be dangerous.
Distribution yield is a ratio. Ratios can rise for two very different reasons: the numerator grows (distributions increase, which is good) or the denominator shrinks (price or NAV falls, which is bad). A fund yielding 9% because its NAV has been declining for three years is not a generous income payer. It is returning your own capital to you in installments.
What we find most underappreciated is the real yield concept. Adjusting distribution yield by NAV change over the same period gives you a far more honest picture of what an income investment is actually delivering. For covered-call and options-income ETFs in particular, headline yields routinely mask significant NAV decay. Investors who track only the distribution figure are, in effect, ignoring half the return equation.
The other gap is tax character. Two funds with identical 5% distribution yields can have meaningfully different after-tax outcomes depending on whether those distributions are qualified dividends, ordinary income, or return of capital. Running a yield calculation tool without factoring in tax treatment gives you a number that may not reflect what you keep.
Use distribution yield as a starting point, not a conclusion. Pair it with total return data, trailing distributions, and real yield before making any income allocation decision.
Evibe gives income investors the full picture, not just the headline yield
Most yield calculators stop at the formula. Evibe starts there and goes further.

For investors who rely on distribution income, Evibe tracks every payout across your entire portfolio — stocks, ETFs, REITs, and more — with automatic syncing from your brokerage accounts. You see yield on cost, real yield adjusted for NAV changes, and distribution history in one place, without manual data entry. Smart alerts notify you when a distribution changes or when NAV drift is affecting your real income return.
If you are managing an income-focused portfolio and want to move beyond a single-number snapshot, track your full portfolio with Evibe and see what your distributions are actually delivering after price changes and taxes.