The Portfolio Diversification Metrics That Actually Matter
Discover essential portfolio diversification metrics like HHI and Diversification Ratio to effectively manage risk and enhance your investment strategy today.
The Portfolio Diversification Metrics That Actually Matter

The most useful portfolio diversification metrics are the Herfindahl-Hirschman Index (HHI), the Diversification Ratio (DR), the Effective Number of Bets (ENB), average pairwise correlation, and entropy-style composite scores. Each answers a different question. HHI tells you how concentrated your capital is. DR tells you how much volatility your combination of holdings actually removed. ENB tells you how many genuinely independent risk sources you're carrying, regardless of how many tickers sit in your account.
The immediate action: compute HHI and DR on your current allocation today. If HHI is high relative to your holding count, or DR sits close to 1.0, you have concentration risk that a simple asset count won't reveal.
- HHI — capital concentration, computed from position weights
- Diversification Ratio (DR) — volatility reduction from combining assets
- Effective Number of Bets (ENB) — count of independent risk drivers
- Average pairwise correlation — how much your holdings move together
- Entropy-style diversification scores — composite index for dashboards
Pro Tip: A single-asset portfolio scores 10,000 on the HHI scale, while an equal-weight 10-asset portfolio scores 1,000. That tenfold gap alone tells you why relying on holding count is misleading.
Key Takeaways
Measuring diversification correctly requires HHI for concentration, Diversification Ratio for volatility reduction, and Effective Number of Bets for hidden factor risk, checked together rather than alone.
| Point | Details |
|---|---|
| Start with HHI | Compute it first for a fast concentration read; single-asset scores 10,000, equal-weight 10-asset scores 1,000. |
| Confirm with DR | A Diversification Ratio near 1.0 means your holdings aren't offsetting each other despite looking spread out. |
| Watch ENB for hidden risk | A low Effective Number of Bets relative to your ticker count signals shared factor exposure. |
| Refresh inputs regularly | Recompute correlation and volatility on rolling windows; stale covariance estimates mislead every downstream metric. |
| Automate the monitoring | Evibe syncs accounts and computes these metrics continuously, flagging drift through AI-driven alerts. |
Table of Contents
- Portfolio Diversification Metrics: What Each One Actually Answers
- The Formulas Behind HHI, DR, ENB, and Portfolio Volatility
- Reading HHI, DR, and ENB Together
- Where These Metrics Break Down
- Turning These Metrics Into a Monitoring Workflow
- Evibe Automates the Diversification Math You Just Read
- Frequently Asked Questions
- Sources
Portfolio Diversification Metrics: What Each One Actually Answers
Before you touch a formula, you need to know which metric answers which question. Investors often check one number, feel satisfied, and miss the risk sitting in a blind spot another metric would have caught.
HHI measures capital concentration. It's the fastest metric to compute and the easiest to explain to a client or committee, but it says nothing about volatility or correlation.
Diversification Ratio measures realized volatility reduction. DR tells you whether combining your holdings actually lowered risk compared to holding each position alone. A portfolio can look well-spread by weight and still produce a DR near 1.0 if the holdings move in lockstep.
Effective Number of Bets estimates independent risk sources. You can own 40 stocks and effectively be making three bets if they're all levered to the same macro factor.
Average pairwise correlation summarizes how much of your return variance comes from shared drivers rather than idiosyncratic ones.
Entropy-style composite scores translate several of these inputs into a single 0 to 100 dashboard number, useful for monitoring but risky if treated as a substitute for the underlying math.
- Check HHI first if you're worried about concentration in a handful of names
- Check DR if you want to know whether diversification is actually reducing risk
- Check ENB if your ticker count feels safe but your gut doesn't
- Check average correlation when sector or macro exposure is the concern
- Use composite scores for ongoing monitoring, not for one-time diagnosis
The Formulas Behind HHI, DR, ENB, and Portfolio Volatility
Here's the math, worked through with numbers you can check against your own spreadsheet.
- HHI: sum the squared percentage weight of every position. A portfolio concentrated in one asset scores 10,000; an equal-weight portfolio of 10 assets scores 1,000. A portfolio with more assets and equal weights scores lower, reflecting greater dispersion. Lower is more dispersed.
- Portfolio volatility (σ_p): computed as σ_p = √(w′ Σ w), where w is your vector of weights and Σ is the covariance matrix of returns. Most practitioners use daily returns over a 90 to 252 day window to build Σ, since covariance and correlation drive whether combining assets actually lowers risk.
- Diversification Ratio (DR): DR = (Σ w_i σ_i) / σ_p, the weighted average of each asset's stand-alone volatility divided by the portfolio's actual volatility. Say two assets each carry 20% stand-alone volatility, equally weighted. If their correlation is low, portfolio volatility might land at 15%, giving DR = 20/15 ≈ 1.33. DR greater than 1 confirms aggregation genuinely reduced volatility; a DR near 1.0 means the assets aren't offsetting each other at all.
- Effective Number of Bets (ENB): usually computed two ways, either as the exponential of return-based entropy across risk factors, or as the inverse of the sum of squared risk contributions. Both convert a messy exposure map into one number representing genuinely independent bets.
- Average pairwise correlation: average all off-diagonal entries in the correlation matrix. Under equal weights and volatilities, DR approximates 1 / √(ρ + (1 − ρ)/N), which shows exactly how correlation ρ and asset count N trade off against each other.
Building this correctly starts with a clean correlation matrix, since a noisy or stale one corrupts every downstream number.
Reading HHI, DR, and ENB Together
None of these metrics work well alone, and that's the point most portfolio reviews miss. HHI and DR frequently diverge because they measure different things: a portfolio can score low on HHI (weights look spread out) while its DR sits near 1.0 because every position is a large-cap tech name moving in the same direction. Conversely, a portfolio with a moderately high HHI, say three positions carrying most of the weight, might still show a respectable DR if those three assets are genuinely uncorrelated.
ENB catches what HHI misses entirely. A portfolio with 50 holdings can produce an ENB of 4 or 5 if most of those tickers share the same sector or factor exposure, exposing risk that a raw position count hides.
There's no universal threshold that works across every mandate. A concentrated venture-style portfolio and a diversified index-tracking fund shouldn't be judged against the same HHI cutoff; the ArXiv research on combining these metrics recommends triangulating across all three rather than anchoring to one benchmark number.
- High HHI → check whether the concentrated names are correlated; if not, the exposure may be intentional and acceptable
- Low DR (near 1.0) → your assets aren't offsetting each other; look at correlation, not weights
- Small ENB relative to holding count → hidden factor concentration; run an ETF overlap check if index funds are involved
Pro Tip: Run all three metrics before rebalancing, not after. Catching a low DR before you add a fourth "diversifying" position that's actually correlated with the rest saves a wasted trade.
Where These Metrics Break Down
Every metric here depends on inputs that shift, and estimation error compounds fast. Volatility and correlation estimates swing meaningfully depending on your lookback window; a 90-day window and a 252-day window can produce noticeably different DR and ENB readings for the same portfolio. Shrinkage estimators and rolling-window sensitivity tests help, but they don't eliminate the problem.
Correlations also aren't stable. Assets that looked uncorrelated in calm markets often move together during a stress event, a phenomenon sometimes called correlation breakdown. Your realized diversification during a crash can be far weaker than what your DR or ENB predicted the week before.
Diversification Quotients (DQs) were built to address this gap. DQs form an axiomatic family of indices satisfying normalization and convexity, explicitly designed to capture tail heaviness and common shocks that HHI and DR routinely miss.
Traditional diversification indices often understate risk concentration precisely when it matters most, during tail events and common shocks, which is the gap DQs were built to close.
- Test HHI, DR, and ENB across multiple lookback windows before trusting a single reading
- Treat correlation estimates as unstable during volatile regimes, not fixed inputs
- Consider DQs or a model-based index once your portfolio complexity outgrows heuristic thresholds
Turning These Metrics Into a Monitoring Workflow
Getting this right operationally comes down to data quality and cadence, not more formulas. Use at least 90 days of daily returns for a fast-moving check and 252 days for a more stable covariance estimate, refreshing both regularly rather than computing once and forgetting it.
- Pull synced account data covering every asset class, not just equities
- Recompute HHI, DR, and ENB on a set cadence, weekly or monthly depending on turnover
- Set a rebalancing trigger when DR drifts toward 1.0 or ENB drops relative to your holding count
- Investigate any HHI spike immediately rather than waiting for the next scheduled review
Evibe automates steps one through three by syncing brokerage and bank accounts directly, computing covariance-based metrics across stocks, ETFs, crypto, and real estate in one dashboard, and flagging drift through AI-driven alerts.
Pro Tip: Don't wait for a scheduled review to catch a concentration spike. A real-time alert catches the drift while it's still cheap to fix.
A Practitioner's Note on Getting Started
Most teams overfit short return windows chasing precision they don't need. Start with HHI and DR, get the governance right, then add ENB and factor models once you trust the pipeline. Try it on one portfolio first.
Evibe Automates the Diversification Math You Just Read
Evibe removes the manual work of tracking these metrics across accounts you'd otherwise check one at a time. Instead of exporting positions into a spreadsheet every month, Evibe syncs your brokerage and bank accounts automatically and computes HHI, DR, and ENB style diagnostics across stocks, ETFs, crypto, real estate, and other holdings in one dashboard.

The AI-driven analysis flags drift the moment your Diversification Ratio slips toward 1.0 or a position's weight pushes your HHI into concentrated territory, so you're not relying on a quarterly review to catch it. Options traders get Greeks and expiry tracking layered into the same view, and dividend-focused investors can pair this with dividend-specific analytics for income-weighted risk checks. If you want to see your own portfolio's concentration and volatility numbers without building the spreadsheet yourself, get started free on Evibe (7 days of Premium included) and run the diagnostic against your current allocation.
Frequently Asked Questions
What is the best single metric to measure portfolio diversification? No single metric captures everything. HHI is the fastest starting point for concentration, but pair it with DR to confirm actual volatility reduction before drawing conclusions.
How do I measure portfolio diversification without a quant background? Composite diversification scores that weight DR, HHI, and average correlation into one number work well for quick checks, though you should still understand what feeds the score.
Why can a portfolio with many holdings still have low diversification? A high holding count can hide low Effective Number of Bets if most positions share the same sector or macro driver, which is exactly what ENB is designed to catch.
How often should I recompute diversification metrics? Monthly recalculation works for most portfolios, though active traders benefit from weekly checks tied to a rebalancing trigger on DR or HHI drift.
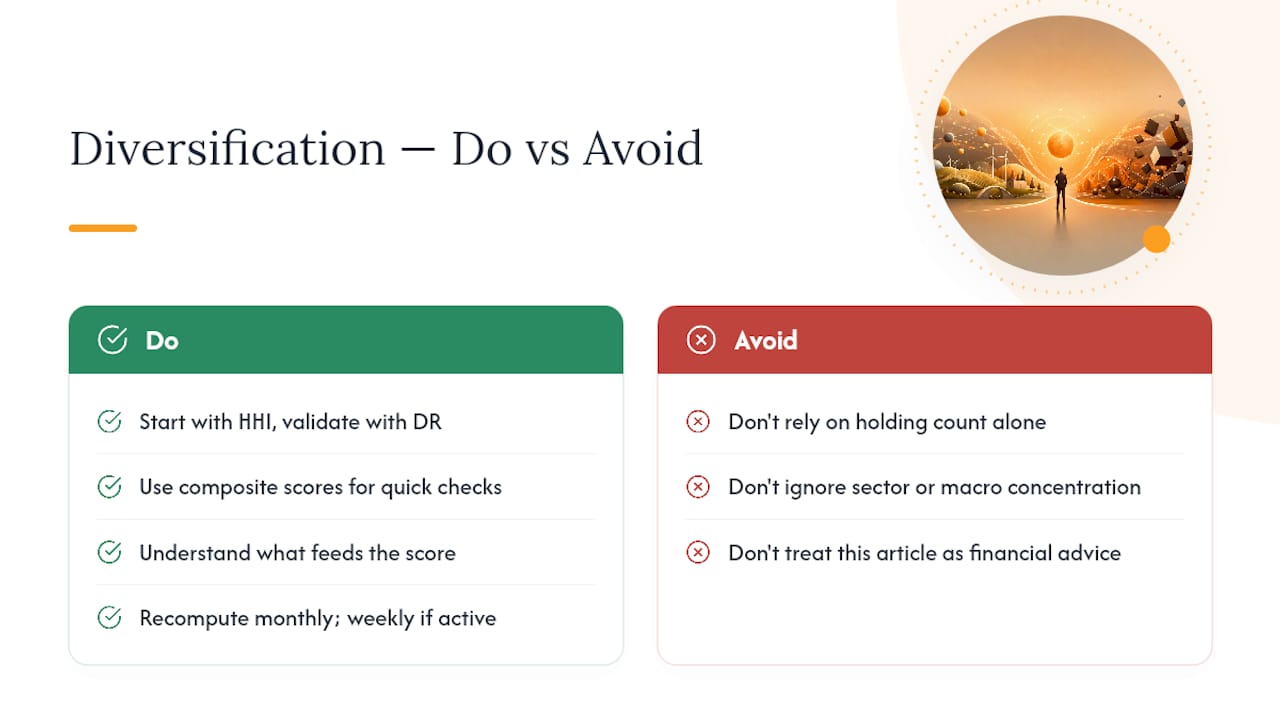
This article is general information, not a substitute for advice from a qualified financial advisor. Consult a qualified financial professional about your own circumstances before acting on anything here.
Sources
- Herfindahl-Hirschman Index
- Diversification quotients: Quantifying diversification via risk measures
- Stock portfolio diversification: HHI vs. Diversification
- The mathematics of portfolio diversification