Track Asset Allocation in Under an Hour, No Spreadsheets Needed
Track asset allocation in under an hour with Evibe’s agnostic setup — no spreadsheets needed. Automate sync and drift alerts. Free to use, 7 days of Premium.
Track Asset Allocation in Under an Hour, No Spreadsheets Needed

The fastest, most reliable way to track asset allocation is an automated multi-account tracker that pulls in real-time balances and flags drift, paired with a periodic spreadsheet audit for anything the tracker can't reach. Core holdings sync automatically; custom or illiquid assets like real estate and private equity get entered manually and checked quarterly. For investors who want this built in from day one rather than stitched together, Evibe consolidates both pieces into one dashboard.
TL;DR:
- Automated trackers like Evibe provide near-zero maintenance after initial setup and automatically incorporate multi-asset and illiquid holdings.
- Drift alerts and look-through ETF analysis help maintain target allocation precision, especially when managing diverse accounts and complex assets.
- Manual processes, such as sector mapping and data gathering, can take 30 to 90 minutes or more, but automation reduces this to a few minutes per account.
- Rebalancing is best triggered by defined thresholds or contribution-based, avoiding unnecessary taxes and emotional decisions, with tax-advantaged accounts prioritized for trades.
- Consistency in tracking is crucial; abandoning tools or confusing account growth with allocation health risks unnoticed drift and overexposure.
Table of Contents
- The Real Options for Tracking Your Asset Allocation
- How to Set Up Your Allocation Tracking in Under an Hour
- What to Actually Watch: The Metrics That Matter
- Rebalancing Without Triggering Unnecessary Taxes
- How Evibe Puts This Entire Workflow on Autopilot
- Adjusting Your Allocation When Life or Markets Shift
- Where Allocation Tracking Usually Goes Wrong
- Connecting Allocation Tracking to Your Bigger Financial Picture
- Choosing an Allocation Model That Fits Your Actual Situation
- What I'd Actually Tell a Friend Setting This Up
- Get Your Full Allocation Picture With Evibe
- Sources
The Real Options for Tracking Your Asset Allocation
Most investors default to whatever tool they already have open, and that's usually a mistake. The right method depends on how many accounts you hold, how many asset classes you're juggling, and how much manual upkeep you're willing to tolerate.
Brokerage and robo-advisor allocation pages are the path of least resistance. Fidelity, Schwab, and similar platforms show you a pie chart of your holdings inside that one account, and Quicken's guidance on monitoring portfolio asset allocation walks through exactly how those built-in views calculate weights from your account holdings. These work fine if your entire investable net worth sits in one place. The moment you add a second brokerage, an old 401(k), or a crypto wallet, the picture breaks. You're now toggling between logins and manually adding percentages in your head, which nobody does consistently for more than a few weeks.
Standalone portfolio trackers solve the multi-account problem by linking everything into a single feed. The value-add isn't just aggregation. It's look-through analysis on ETFs and mutual funds (seeing the actual stocks inside a fund rather than treating it as one opaque line item), automated drift alerts, and benchmarking against indices without you touching a formula. This is where most serious individual investors eventually land, because the alternative is rebuilding that logic by hand every month.
Spreadsheet templates remain the right call in specific situations: you have a simple portfolio, you want full control over how categories are defined, or you just don't trust automated sync enough yet. The Bogleheads community maintains a free Google Sheet built specifically for asset allocation tracking, and there are additional shareable templates you can copy and adapt to your own account structure. Spreadsheets cost nothing and bend to whatever categories matter to you. They also require you to manually update prices and holdings every time you check them, which is where most people quietly abandon the habit around month three.
Here's how the three approaches stack up on the factors that actually matter:
- Setup time: Brokerage pages, zero. Spreadsheets, 30 to 90 minutes. Standalone trackers, 10 to 20 minutes per linked account.
- Ongoing maintenance: Brokerage pages, none but incomplete. Spreadsheets, manual updates every review. Trackers, near-zero after initial linking.
- Multi-account visibility: Brokerage pages, no. Spreadsheets, yes if you input everything. Trackers, yes automatically.
- Custom or illiquid assets: Brokerage pages, no. Spreadsheets, yes. Trackers, usually via manual entry fields.
For anyone holding real estate, a startup stake, or collectibles alongside public securities, a hybrid setup is the practical answer: let an automated tracker handle the liquid, syncable accounts and log the custom assets manually inside the same view. Evibe's approach to tracking crypto alongside your full net worth is one example of how nonstandard assets get folded into a single allocation picture rather than living in a separate spreadsheet tab nobody opens.
How to Set Up Your Allocation Tracking in Under an Hour
Getting a working view of your allocation isn't complicated. It's tedious if you do it manually across five accounts, which is exactly why most people never finish. Here's the sequence that works whether you're building a spreadsheet from scratch or configuring a tracker app.
Step 1: Gather your holdings data. For each account, you need the ticker or asset name, quantity held, account type (taxable, Roth IRA, 401(k), and so on), and current price or cost basis. Most brokerages let you export a CSV directly from the positions page. If you're using a tool with account linking, this step is automatic. If you're building a spreadsheet, a CSV-based import workflow like the one in the open-source portfolio-tracker project on GitHub shows a clean structure for organizing this data before you start calculating anything.

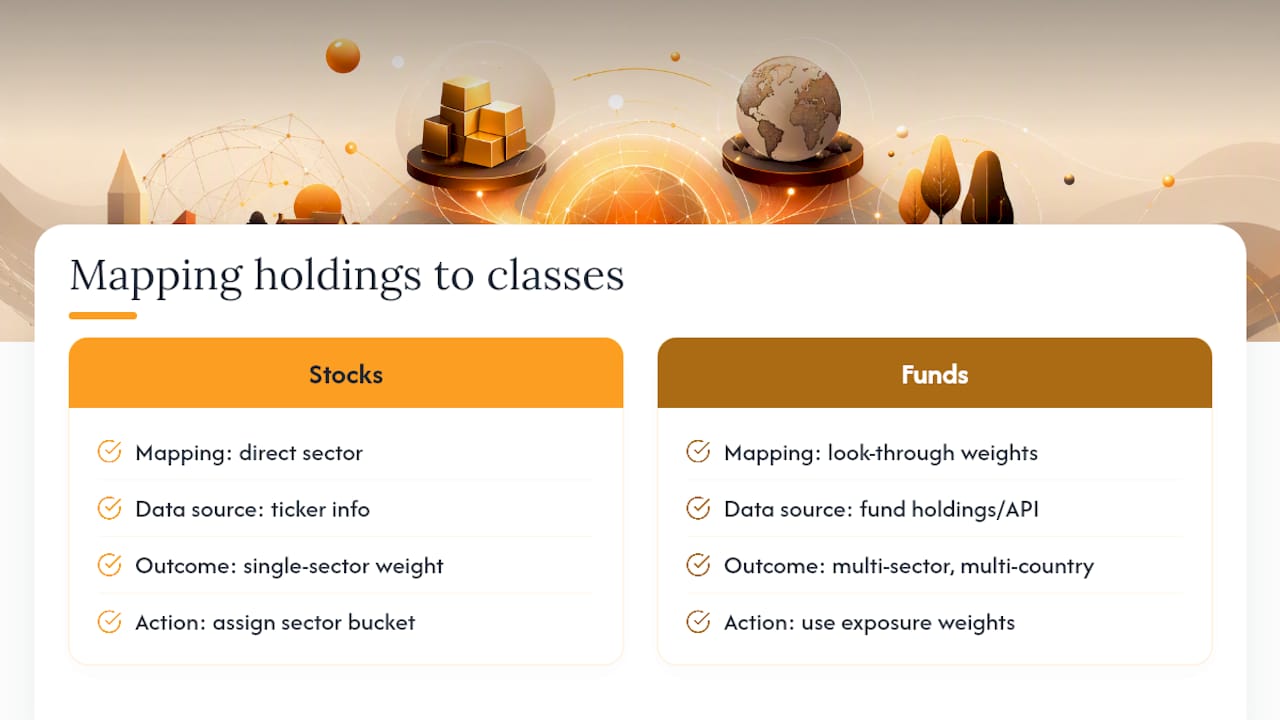
Step 2: Map each holding to an asset class and sector. This is where accuracy separates a useful allocation view from a misleading one. Individual stocks are straightforward: assign the sector directly. ETFs and mutual funds are not, because a single fund ticker can span a dozen sectors and multiple asset classes. Use look-through data where you can get it. APIs that compute fund and ETF exposure by sector, country, and asset class exist specifically to solve this, returning weights that close to an exact 100% rather than the rough estimates you get from eyeballing a fund fact sheet.
Step 3: Calculate current weight, target weight, and drift. Current weight is simply that holding's market value divided by total portfolio value. Drift is current weight minus target weight. If your target is 60% equities and you're sitting at 67%, that's 7 percentage points of drift, and it's the single number that should trigger a rebalancing conversation. A quick structural audit using a tool like a portfolio analyzer can surface these weights and concentration figures fast if you're running the numbers manually for the first time.
Step 4: Set drift thresholds and a review cadence. Most disciplined investors set an alert threshold between 3% and 5% drift on any major asset class, then commit to a full review every quarter regardless of whether an alert fired. Write both numbers down. A threshold you don't actually enforce is decoration, not a system.

Pro Tip: Odd securities (SPACs, thinly traded ADRs, private placements) rarely have clean sector data available through automated feeds. Tag these manually as "unclassified" in your tracker rather than forcing them into a sector bucket that doesn't fit. A wrong classification is worse than an honest gap.
If a holding won't map cleanly, don't force it. Non-standard assets like collectibles, private loans, or vehicle equity should get their own asset class bucket rather than being crammed into "alternatives" as a catchall, since that bucket becomes meaningless the moment it holds three unrelated things.
What to Actually Watch: The Metrics That Matter
Tracking allocation isn't just glancing at a pie chart once a quarter. Four numbers tell you almost everything about whether your portfolio matches your intentions.
Current allocation versus target allocation is the baseline. If you set a target of 70% stocks, 25% bonds, 5% cash, your dashboard should show where you actually sit against that line, not just where you sit in isolation. Drift, again, is the gap between the two, and it's the number that should drive every rebalancing decision rather than gut feel about market conditions.
Concentration deserves more attention than most investors give it. Calculate what percentage of your total portfolio sits in your top three and top five holdings.
- Top-3 holdings concentration above a moderate level of total portfolio value is worth a second look.
- Sector overlap between two or more funds you hold can silently double your exposure.
- Correlation between asset classes matters more than the count of asset classes.
That correlation point deserves unpacking. Diversification by number of holdings is a comforting illusion if those holdings move together. Owning a growth stock fund, a tech-heavy index, and individual FAANG shares gives you three line items and one real bet. Look-through analysis on the individual holdings inside your ETFs frequently reveals concentration an investor didn't know they had, because the fund names never hinted at the overlap.
One trap worth naming directly: a rising account balance doesn't mean your allocation is healthy. New contributions and market gains change your dollar amounts without necessarily changing your percentage weights in a way that reflects intent. Separate "my portfolio grew" from "my allocation shifted." They're different signals, and conflating them is how investors miss drift for years while feeling reassured by a growing number.
Rebalancing Without Triggering Unnecessary Taxes
There are three standard rebalancing triggers, and picking the right one for your situation matters more than picking the "best" one in the abstract.
- Calendar-based rebalancing happens on a fixed schedule, typically annually. It's predictable and low-effort, but it can leave you overweight an asset class for months if markets move fast between review dates.
- Threshold-based rebalancing triggers whenever an asset class drifts past a set percentage, commonly 3% to 5%, an approach industry guidance on portfolio rebalancing commonly recommends. This reacts faster to real market moves but requires you to actually monitor drift continuously, which is exactly what an alert-based tracker automates.
- New-money rebalancing uses fresh contributions to buy whatever asset class is underweight, rather than selling anything. This is the most tax-efficient option for investors still actively contributing, since it avoids triggering capital gains entirely.
When you do need to sell to rebalance, sequencing determines how much you keep. Trade inside tax-advantaged accounts first (IRAs, 401(k)s) since gains and losses there carry no immediate tax consequence. Only after exhausting that room should you rebalance inside taxable brokerage accounts, and when you do, look for tax-loss harvesting opportunities on the way, selling a losing position to both correct drift and offset gains elsewhere.
Pro Tip: Small accounts under a few thousand dollars often lose more to trading costs and bid-ask spreads than they gain from precise rebalancing. If your drift is minor and your account is small, let new contributions do the rebalancing work instead of triggering trades.
A short quarterly checklist keeps this from becoming guesswork: check current drift against target for every asset class, confirm whether any single holding crossed your concentration threshold, execute trades in tax-advantaged accounts first if action is needed, and log the date and reasoning for any trade you make. That log matters more than people expect. Six months later, you want to know whether you rebalanced because of a real thesis or a knee-jerk reaction to a bad week in the market.
How Evibe Puts This Entire Workflow on Autopilot
Everything described above, exporting CSVs, mapping sectors by hand, calculating drift with formulas, is exactly the manual work Evibe was built to remove. The setup steps still apply conceptually; the execution just stops requiring your time.
- Automatic account sync pulls balances and holdings directly from linked banks and brokerages, replacing the CSV export step entirely.
- Multi-asset consolidation brings stocks, ETFs, options, crypto, real estate, and other custom holdings into one dashboard instead of scattered spreadsheet tabs.
- Drift alerts notify you when an asset class crosses your defined threshold, so you're not manually checking percentages every week.
- ETF look-through and sector classification happen automatically, addressing the mapping problem from Step 2 without a separate API call.
- Options tracking with Greeks and expiry calendars, plus advanced dividend tracking, cover the asset types that plain allocation trackers usually skip.
| What the setup process requires | How Evibe handles it |
|---|---|
| Exporting holdings from each brokerage | Automatic sync via linked accounts |
| Manually mapping ETFs to sectors | Built-in look-through classification |
| Calculating drift with formulas | Real-time drift alerts |
| Tracking options and dividends separately | Native options and dividend modules |
| Benchmarking against an index by hand | Built-in index benchmarking |
Evibe is free to use, and every new account gets 7 days of Premium through the iOS and macOS app before any subscription charge applies, giving readers room to connect accounts and see their real allocation picture before committing. The ETF tracker and options tracker pages detail how each asset type is handled specifically.
Adjusting Your Allocation When Life or Markets Shift
A target allocation isn't a permanent setting. Markets move and life happens, and both should prompt a deliberate review rather than a reactive trade.
Market-driven adjustments should be rare and rules-based. A sharp downturn that pushes your equity allocation below target through no action of your own is often best addressed by simply continuing your normal contribution schedule rather than panic-buying to "catch up." The exception is when your drift threshold is genuinely breached, at which point your predefined rebalancing rule, not the day's headlines, should decide the trade.
Life events are the more legitimate reason to change your target allocation itself. A new job with a higher income might let you take on more risk. Approaching a home purchase in the next two years might mean pulling that specific savings bucket into cash regardless of your long-term target. Marriage, a new dependent, or nearing retirement are the classic triggers for revisiting your target percentages, not just your current holdings.
The mistake to avoid is treating every market headline as a life event. If nothing about your income, timeline, or risk tolerance has actually changed, your target allocation shouldn't change either. Update the target deliberately, on your own schedule, and let your tracker handle the ongoing measurement against it.
Where Allocation Tracking Usually Goes Wrong
The most common mistake isn't a bad tool choice. It's inconsistency. An investor sets up a beautiful spreadsheet, uses it diligently for six weeks, and then stops updating it the first time life gets busy. A tracking system you abandon after two months provides zero value regardless of how sophisticated it was on day one.
The second mistake is confusing account balance growth with allocation health, a point worth restating because it's the single most common misread of a portfolio dashboard. Your account went up 12% this year, so everything feels fine, except your equity weight quietly climbed from 65% to 78% because stocks outperformed bonds the entire time.
Sector double-counting is the third trap, and it's subtle. Holding a total market index fund alongside a dedicated technology sector fund feels diversified on paper. In practice, you've just overweighted tech twice through two different vehicles, and a naive allocation view that treats each fund as a single "equities" line item won't catch it.
Ignoring account type is the fourth pitfall. A target allocation should typically apply across your entire net worth, not per account.
Finally, over-monitoring causes its own damage. Checking allocation daily invites emotional trades based on short-term noise. A quarterly cadence, enforced by an alert threshold rather than curiosity, produces better long-term outcomes than obsessive daily checking ever does.
Connecting Allocation Tracking to Your Bigger Financial Picture
Allocation tracking in isolation is a bookkeeping exercise. It only earns its keep when it's tied to the actual goals your money is supposed to accomplish, retirement at a certain age, a home purchase in five years, funding a child's education.
Each goal typically implies its own target allocation and its own timeline for de-risking. Retirement savings decades out can tolerate an aggressive equity-heavy target. Money earmarked for a down payment in eighteen months has no business sitting in the same allocation bucket, regardless of how well that equity position has performed recently. Mixing these goals into one undifferentiated portfolio view is how people accidentally take on far more risk than their nearest-term goal can handle.
Practically, this means your tracker should let you tag holdings or accounts by purpose, not just by asset class. A brokerage account earmarked for a house down payment should carry its own target allocation, likely conservative, separate from your retirement accounts' target. Reviewing allocation drift without reviewing it against the goal timeline attached to that money is only half the exercise. The number on the screen means little without knowing what it's supposed to be funding and when.
Choosing an Allocation Model That Fits Your Actual Situation
Most target allocations trace back to one of a few standard models, and picking one gives your drift thresholds and rebalancing rules an actual reference point instead of a guess.
Age-based models, sometimes summarized as "110 minus your age in stocks," scale down equity exposure as retirement approaches. They're a reasonable default for someone without strong opinions about their own risk tolerance, but they're blunt: two 45-year-olds with wildly different job security and savings rates shouldn't necessarily land on the same target.
Risk-tolerance-based models start from a questionnaire or a gut-check conversation about how much portfolio volatility you can stomach without making panicked decisions, then build a target allocation around that answer rather than your birth year. This tends to produce a more personally sustainable target, since the biggest threat to any allocation strategy is abandoning it during a downturn.
Goal-based models assign a different target allocation to each financial goal individually, as described above, rather than applying one blended target across your entire net worth. This is more work to set up and track, but it's the most accurate reflection of how money actually gets spent over time.
None of these models is inherently superior. The one that works is the one you'll actually maintain and rebalance against consistently, which is as much a behavioral question as a financial one.
What I'd Actually Tell a Friend Setting This Up
If your portfolio lives in three accounts or fewer with mostly plain-vanilla index funds, a spreadsheet is genuinely fine. It costs nothing, and the discipline of manually updating it teaches you your own numbers in a way automation sometimes lets you skip past. Once you're past four or five accounts, or you're holding options, crypto, or illiquid assets alongside public securities, the manual math stops being a minor inconvenience and starts being the reason you quietly stop checking altogether.
My honest recommendation: automate the parts of this that are purely mechanical, syncing balances, calculating drift, flagging concentration, and reserve your actual attention for the judgment calls, like whether a life event should change your target or whether a sector overweight is intentional. Do a full manual audit once a year regardless of what tool you use, because automated classification occasionally misfires on unusual securities. Pick one system, commit to the quarterly review, and stop rebuilding your tracking method every few months looking for a perfect one that doesn't exist.
— Vincent
Get Your Full Allocation Picture With Evibe
Everything in this guide, CSV exports, manual sector mapping, drift formulas, is the work Evibe automates the moment you link your accounts. Instead of stitching together a brokerage view, a spreadsheet, and a separate crypto tracker, you get one dashboard that syncs stocks, ETFs, options, crypto, real estate, and other custom assets in real time, with drift alerts and sector look-through already built in.

For income-focused investors, the dividend tracker adds yield-on-cost and payment history on top of your allocation view, so you're not juggling a second tool just to see your cash flow. If you'd rather work with a professional on portfolio strategy directly, Bright Capital America's portfolio management services are worth a look too. But if you want to see your own numbers first, get started free on Evibe — 7 days of Premium included — and connect your accounts. You'll have a real allocation view before you finish your coffee.
This article is general information, not a substitute for advice from a qualified financial advisor. Consult a qualified financial professional about your own circumstances before acting on anything here.
Sources
- How do I monitor my portfolio's asset allocation?
- A Free Google Sheet for Asset Allocation Tracking
- portfolio-tracker releases