SEC Yield vs Distribution Yield: What Income Investors Need to Know
Learn the key differences between SEC yield and distribution yield, and discover which metric better reflects true income for your investment strategy.
SEC Yield vs Distribution Yield: What Income Investors Need to Know

The SEC (30-day) yield is a standardized, annualized income measure calculated over the prior 30 days, net of fund expenses, and required by the U.S. Securities and Exchange Commission for consistent fund disclosure. The distribution yield (trailing 12-month, or TTM) reports the actual cash distributions a fund paid over the past year as a percentage of its current price. Use SEC yield when comparing bond funds or ETFs side by side. Use distribution yield when you want to understand the actual cash flow a fund has historically delivered, but always verify what that number includes before budgeting from it.
Three sources worth bookmarking before you go further:
- SEC yield: Investopedia's explainer covers the formula and its standardization advantage clearly.
- Distribution yield: Schwab Asset Management shows how provider definitions differ and why that matters.
- Regulatory standard: The SEC's own site is the authoritative source for the calculation requirement and fund disclosure rules.
Key Takeaways
SEC yield is the right metric for comparing bond funds and income ETFs; distribution yield is the right metric for reviewing historical cash flow, but only after you confirm what it includes.
| Point | Details |
|---|---|
| Use SEC yield for comparisons | It is standardized, expense-adjusted, and mandated by the SEC, making it the only apples-to-apples income benchmark. |
| Distribution yield is not standardized | Providers like Schwab exclude capital gains; others include them, so the same fund can show different TTM yields on different platforms. |
| A large gap signals investigation | When distribution yield materially exceeds SEC yield, check for capital gains, return of capital, or option premiums in the payout. |
| Check Section 19(a) notices | These required filings disclose when a distribution includes return of capital or capital gains, and are the fastest way to verify payout sources. |
| Evibe tracks both metrics | Evibe's dividend tracker and ETF analytics consolidate distribution history and yield data across all holdings in one synced dashboard. |
Table of Contents
- What is the SEC 30-day yield, and how is it calculated?
- What is distribution yield, and why do providers calculate it differently?
- How do SEC yield and distribution yield compare?
- How to interpret both yields when choosing bond funds or income ETFs
- Worked examples: seeing both yields on the same fund
- Where to find SEC yield and distribution yield on fund pages
- Other yield metrics worth checking alongside SEC and distribution yield
- What asset managers and data providers say about yield metrics
- The yield number that actually matters depends on what you are trying to decide
- Evibe tracks both yield metrics across your entire portfolio
- Sources
What is the SEC 30-day yield, and how is it calculated?
The SEC 30-day yield answers a specific question: how much income did this fund generate over the last 30 days, annualized, after expenses? Every fund that reports it uses the same formula, which is what makes it genuinely useful for comparison.
At a high level, the calculation takes the income earned by the fund's holdings over the 30-day period, subtracts the fund's accrued expenses, and divides by the maximum offering price per share on the last day of the period. That result is then annualized. The SEC mandates this formula for bond funds, which means a Vanguard total bond fund and a Schwab corporate bond ETF are both reporting on the same basis when they display their SEC yield.
What the SEC yield includes:
- Interest income from bonds and other fixed-income holdings
- Dividend income from equity holdings (in balanced or multi-asset funds)
- Accrued income over the 30-day window
What the SEC yield excludes:
- Capital gains distributions
- Return of capital
- Option premiums (relevant for covered-call or derivative-income funds)
- Any income earned outside the 30-day window
One important exception: money-market funds typically report a 7-day SEC yield rather than a 30-day figure, since their portfolios turn over faster and a shorter window is more representative of current conditions.
The standardization is the key advantage. Because expenses are netted out and the formula is fixed, the SEC yield lets you compare bond funds on a level playing field regardless of how each fund structures its distributions or what its expense ratio is.
What is distribution yield, and why do providers calculate it differently?
Distribution yield reports what a fund actually paid out over the trailing 12 months as a percentage of its current net asset value (NAV) or price. The basic math: sum all distributions over the prior year, divide by the current NAV, and express as a percentage. Simple enough, except that "distributions" is where the definitions diverge.
Schwab Asset Management explicitly notes that its TTM distribution yield calculation excludes capital gains, while other providers include them. That single difference can produce meaningfully different numbers for the same fund. Some data vendors go further and annualize only the most recent distribution (multiplying it by 12) rather than summing the actual trailing 12 months, which can overstate or understate the yield depending on whether the most recent payout was unusually large or small.
Common items that can inflate a distribution yield:
- Long-term capital gains distributions passed through to shareholders at year-end
- Return of capital (ROC): the fund returns your own principal, which looks like income but is not
- Option premiums: covered-call ETFs collect premium income that shows up in distributions but is not traditional bond or dividend income
- One-time special distributions: a fund liquidating a position may pay a large one-off amount that inflates the TTM figure for the next 12 months.
The practical implication: a fund's distribution yield can appear higher than its SEC yield precisely because it captures these non-income sources. That gap is not automatically a red flag, but it does require investigation.
Pro Tip: Before relying on any distribution yield figure, read the issuer's or data provider's definition. Check whether capital gains are included, whether the calculation uses TTM or annualized-latest-distribution, and whether any portion is return of capital. Vanguard, Schwab, and Morningstar each publish their methodology, and they are not identical.
How do SEC yield and distribution yield compare?
The two metrics measure different things over different time windows, and treating them as interchangeable is one of the most common mistakes income investors make.
| Dimension | SEC (30-day) yield | Distribution yield (TTM) |
|---|---|---|
| Time window | Prior 30 days, annualized | Trailing 12 months |
| Standardization | SEC-mandated formula, uniform across funds | Provider-dependent; no universal standard |
| Expense treatment | Net of fund expenses | Gross; expenses not explicitly netted |
| Capital gains included | No | Often yes, depending on provider |
| Forward vs. backward | More current; reflects recent income | Purely historical cash paid |
| Best use case | Apples-to-apples fund comparison | Estimating historical cash flow |
The single most useful rule: screen and compare funds using SEC yield, then cross-check distribution yield to understand what the fund has actually been paying and whether that cash flow is sustainable.
How to interpret both yields when choosing bond funds or income ETFs
Knowing the definitions is step one. Knowing when each number is telling you something actionable is what actually matters.
Use SEC yield when:
- Comparing two or more bond funds or income ETFs to decide which offers better income per unit of expense
- Evaluating whether a fund's stated yield reflects current market conditions (the 30-day window is more sensitive to recent rate moves than a 12-month trailing figure)
- Screening a fund universe and you need a consistent basis for ranking
Use distribution yield when:
- Estimating the actual cash a fund has deposited into your account over the past year
- Budgeting for retirement income or cash-flow planning, where the dollar amount matters more than the standardized rate
- Checking whether a fund's historical payouts have been consistent or volatile
Red flags to investigate when the two yields diverge significantly:
- A distribution yield materially higher than SEC yield often signals capital gains, return of capital, or option premiums in the payout mix
- A distribution yield lower than SEC yield can indicate the fund recently cut its payout or that NAV has risen sharply
- Fee waivers or expense subsidies can temporarily inflate SEC yield; check the fund's prospectus for waiver expiration dates
- Section 19(a) notices, which funds are required to send when a distribution includes return of capital or capital gains, are the fastest way to identify what is actually in a payout
Quick checklist before relying on either yield figure:
- Which formula does this provider use for distribution yield?
- Does the displayed distribution yield include capital gains?
- Has the fund issued any Section 19(a) notices in the past 12 months?
- Is there an active fee waiver that may expire and compress the SEC yield?
- Does the fund's prospectus confirm the income sources behind the distribution?
Worked examples: seeing both yields on the same fund
These examples use hypothetical but realistic numbers to show how the two metrics can align or diverge.
Example 1: A straightforward investment-grade bond fund
- The fund holds a diversified portfolio of investment-grade corporate bonds.
- Over the prior 30 days, it earned $0.042 per share in interest income, net of its 0.04% expense ratio.
- Annualized: $0.042 × 12 = $0.504 per share per year.
- Current maximum offering price: $10.50 per share.
- SEC yield = $0.504 / $10.50 = 4.80%
- Over the trailing 12 months, the fund paid $0.498 per share in distributions, all from interest income.
- Current NAV: $10.50.
- Distribution yield = $0.498 / $10.50 = 4.74%
The two yields are close, which is what you expect from a plain bond fund with no capital gains distributions and no return of capital. The small difference reflects the 30-day window capturing slightly higher recent interest rates than the full-year average.
Example 2: A covered-call income ETF
- The fund holds equities and sells covered-call options to generate premium income.
- Over the prior 30 days, it earned $0.028 per share in dividends and interest, net of expenses.
- Annualized: $0.028 × 12 = $0.336 per share.
- Current maximum offering price: $25.00.
- SEC yield = $0.336 / $25.00 = 1.34%
- Over the trailing 12 months, the fund paid $1.80 per share in distributions, which included $1.20 in option premiums and $0.60 in dividends.
- Current NAV: $25.00.
- Distribution yield = $1.80 / $25.00 = 7.20%
The SEC yield only captures traditional income; it excludes the option premiums that make up the bulk of this fund's payouts. Neither number is wrong, but using the distribution yield to compare this fund against a plain bond fund would be misleading.
Pro Tip: If a fund's SEC yield is significantly lower than its distribution yield, pull the fund's most recent Section 19(a) notice or annual report to see exactly how the payout breaks down. A high distribution yield built on option premiums or return of capital is not the same as one built on bond interest.
Where to find SEC yield and distribution yield on fund pages
Both figures are publicly available, but you need to know where to look and what to verify once you find them.
Primary sources:
- Fund factsheet: Most issuers (Vanguard, Schwab, iShares, SPDR) publish a one-page factsheet for each fund that lists both SEC yield and distribution yield. These are updated monthly.
- Fund prospectus and Statement of Additional Information (SAI): The prospectus defines how the fund calculates and reports yield. The SAI often contains more detail on income sources.
- Issuer product page: Vanguard and Schwab both display SEC yield prominently on their ETF and mutual fund product pages, alongside TTM distribution yield.
- Section 19(a) notices: Required when a distribution includes return of capital or capital gains. Filed with the SEC and typically posted on the issuer's website.
- Morningstar: Displays both metrics on fund pages and standardizes some of the presentation, though its distribution yield calculation may differ from the issuer's.
What to verify when you find the numbers:
- Does the provider's distribution yield include or exclude capital gains?
- Is the distribution yield TTM or annualized-latest-distribution?
- Is the SEC yield subsidized by a fee waiver?
- What is the tax character of distributions (ordinary income, qualified dividends, long-term capital gains, return of capital)? Check Form 1099-DIV at year-end.
- Has the fund's NAV changed significantly, which would affect the yield denominator?
For cross-checking, Morningstar is a reliable third-party source, and the SEC's EDGAR database lets you pull fund filings directly.
Other yield metrics worth checking alongside SEC and distribution yield
SEC yield and distribution yield answer income-specific questions. They do not tell you everything about a bond fund's risk or total return potential.
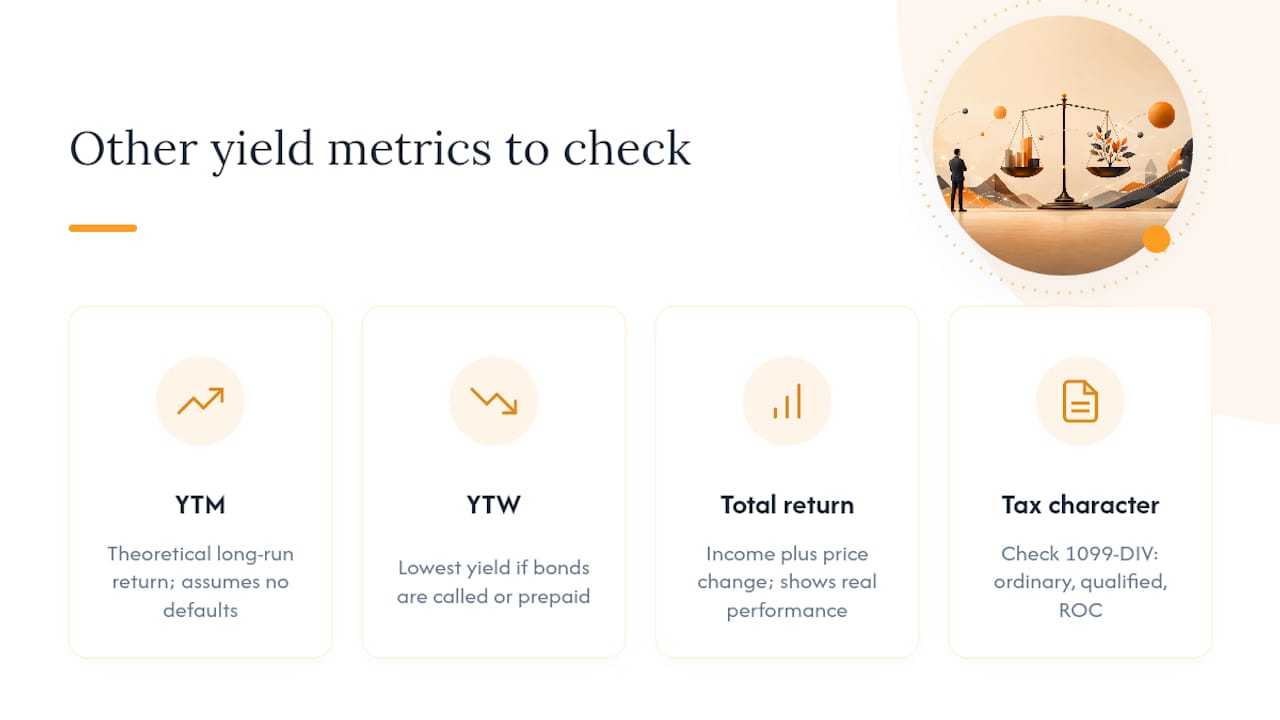
Yield to maturity (YTM): The total return anticipated if all bonds in the portfolio are held to maturity, assuming coupons are reinvested. YTM is useful for understanding the fund's theoretical long-run return but assumes no defaults and no reinvestment-rate changes.
Yield to worst (YTW): The lowest yield a bond can produce given all possible call or prepayment scenarios. For funds holding callable bonds, YTW is more conservative and more realistic than YTM. State Street Global Advisors recommends reviewing YTW alongside SEC yield precisely because callable bonds can be redeemed before maturity, cutting off the income stream you were counting on.
Total return: Combines income distributions and price appreciation (or depreciation). A fund can show a high distribution yield while its NAV erodes, producing a negative total return. For wealth preservation, total return is the number that matters most.
Distribution rate: Sometimes used interchangeably with distribution yield, but occasionally defined as the most recent monthly distribution annualized, divided by NAV. Check the definition; it can differ from TTM yield.
Yield on cost: Your personal income yield based on what you originally paid for the fund, not the current price. Useful for tracking how your income has grown relative to your cost basis, but not relevant for comparing funds.
One follow-up step that is easy to overlook: once you have confirmed the distribution yield and its sources, check the tax character on your year-end Form 1099-DIV. Ordinary income, qualified dividends, and return of capital are taxed differently, and a high distribution yield that is mostly return of capital may be less valuable after taxes than a lower yield composed entirely of qualified dividends.
What asset managers and data providers say about yield metrics
The consensus from institutional sources is consistent: no single yield figure tells the full story, and standardization matters more than most investors realize.
Schwab Asset Management notes that distribution yield calculations differ by issuer and that Schwab's own TTM calculation excludes capital gains — a meaningful distinction when comparing funds across platforms, since another provider's figure for the same fund may include them.
Schwab's guidance on ETF yield evaluation is one of the clearest issuer-level explanations of why TTM numbers are not always comparable across data sources.
Investopedia's coverage of the SEC yield formula underlines the standardization advantage: because the SEC mandates the calculation, investors can trust that two funds reporting a 4.5% SEC yield are reporting on the same basis. That is not true for distribution yield.
State Street Global Advisors advises looking beyond yield metrics entirely when evaluating bond funds, specifically recommending total return and yield-to-worst as essential complements to any income-focused screen.
Best practices derived from institutional guidance:
- Use SEC yield as your primary comparison metric when screening bond funds or income ETFs.
- Treat distribution yield as a secondary check on historical cash flow, not a benchmark.
- Always confirm which definition a data provider uses before comparing distribution yields across platforms.
- Pull Section 19(a) notices when distribution yield exceeds SEC yield by more than a small margin.
- Review YTW for any fund holding callable bonds or mortgage-backed securities.
- Check total return over 3 and 5 years alongside yield to assess whether income is coming at the cost of NAV erosion.
The yield number that actually matters depends on what you are trying to decide
Here is the practical reality: most income investors spend too much time on the distribution yield and not enough on the SEC yield. The distribution yield is the number that shows up on brokerage account pages and fund screeners in the most prominent position, and it is often the higher of the two, which makes it feel more attractive. That is exactly when it can mislead you.
When we screen for income funds, SEC yield is the starting point. It is standardized, expense-adjusted, and reflects what the fund is earning right now, not what it paid out over a period that may have included a one-time capital gain or an unusually large option premium. Distribution yield comes in as a verification step: does the fund's historical cash flow match what the SEC yield suggests it should be paying? If the two are close, the fund's income is likely coming from genuine interest or dividends. If the distribution yield is materially higher, dig into the sources before you budget from it.
The habit worth building: screen by SEC yield, verify distribution sources before budgeting. One number for comparison, one for cash-flow planning, and neither in isolation.
Evibe tracks both yield metrics across your entire portfolio
Manually pulling SEC yield and distribution yield from a dozen fund pages, cross-checking provider definitions, and tracking Section 19(a) notices is time-consuming. Evibe consolidates that work.

With Evibe's dividend tracker, you can monitor historical distributions across all your holdings in one place, with executed, declared, and estimated payouts displayed together. The app syncs automatically with your brokerage accounts, so your distribution history is always current without manual entry. Evibe's ETF analytics surface yield data alongside performance benchmarks, giving you the context to spot a distribution-yield-to-SEC-yield gap without opening five browser tabs. AI-driven analysis flags unusual income patterns and helps you assess whether your portfolio's income is coming from sustainable sources.
Get started free at Evibe — 7 days of Premium included — and see how much clearer your income picture gets when all your funds are in one view. Premium is managed through the Apple App Store.
Sources
These are the primary references for verifying yield formulas, reading issuer definitions, and understanding regulatory requirements.
- Understanding SEC 30-Day Yield: Definition, Formula, and Examples
- Evaluating ETF yield
- Bond yield metrics: How they work
- Sec
This article is for general informational purposes only and does not constitute investment, tax, or financial advice. Verify current fund data and consult a qualified financial professional before making investment decisions.
This article is general information, not a substitute for advice from a qualified financial advisor. Consult a qualified financial professional about your own circumstances before acting on anything here.