Investors: When 7% Looks Like 4%, Fix Money Weighted Return with XIRR
Practical guide for investors to compute money weighted return with XIRR, avoid date and sign errors in spreadsheets, and automate cash flows with account...
Investors: When 7% Looks Like 4%, Fix Money Weighted Return with XIRR

Money-weighted return, also called the dollar-weighted return or IRR, is the single annualized rate that accounts for the timing and size of every cash flow into and out of your portfolio. It measures what your dollars actually earned, not just what the market did. Use it to track personal progress and financial planning. Skip it when you're comparing one manager or fund against another; that's a job for time-weighted return.
TL;DR:
- The money-weighted return accurately reflects individual investment outcomes by weighting returns according to the timing and size of cash flows, unlike the time-weighted return.
- Calculating MWRR requires organizing all cash flows with exact dates, confirming sign conventions, and using spreadsheet functions like XIRR, which automatically iterates to find the correct rate.
- Cash flow timing, especially with multiple contributions or withdrawals, can significantly cause MWRR to diverge from TWR, highlighting different insights about strategy performance versus personal results.
- Automated portfolio tracking tools that sync accounts and record every transaction help prevent common errors and make ongoing MWRR calculation practical and accurate.
- Use MWRR to monitor personal progress and TWR to evaluate the investment strategy or manager, and always present both together for clear, trustworthy reporting.
Table of Contents
- What Is Money-Weighted Return (MWRR)?
- How Do You Calculate Money-Weighted Return?
- How Do You Calculate XIRR in Excel or Google Sheets?
- Money-Weighted vs. Time-Weighted Return: Which Should You Use?
- What Does Your Money-Weighted Return Actually Tell You?
- What Are the Common Mistakes When Calculating MWRR?
- How Portfolio Trackers Make MWRR Practical
- Should You Track MWRR or TWR? A Practical Rule of Thumb
- Track Your Real Returns Without the Spreadsheet Headaches
- Sources
- FAQ
What Is Money-Weighted Return (MWRR)?
Money-weighted rate of return is mathematically the same number as your portfolio's internal rate of return, or IRR. You'll see it abbreviated MWRR, called the dollar-weighted return, or just referred to as IRR depending on which textbook or app you're reading. All three point at the same calculation.
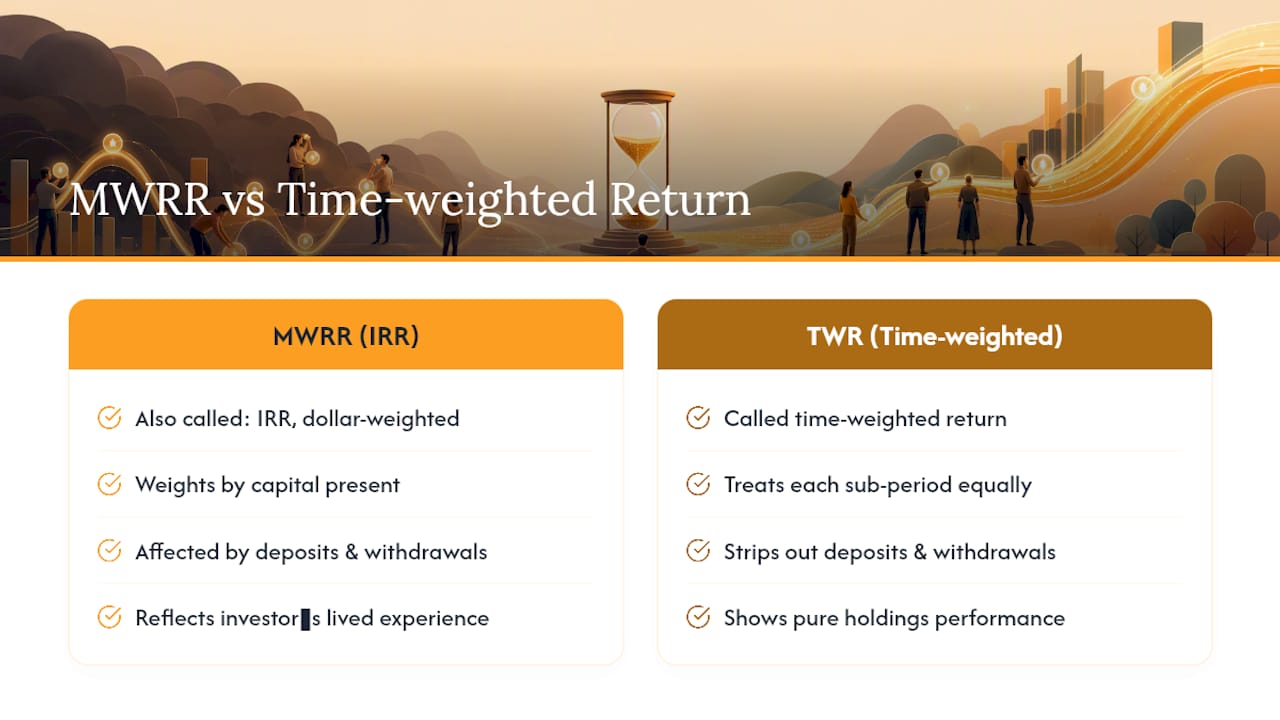
Here's the intuition. MWRR weights each period of your investing history by how much capital was actually working during that period. If you added a large lump sum right before a strong quarter, that quarter pulls harder on your overall return than a quarter when you had a small starting balance and made no contributions. That's the "money-weighted" part. The metric literally weights results by the money that was present when they happened.
This is different from time-weighted return, which strips out the effect of your deposits and withdrawals so you can see the pure performance of the underlying holdings. TWR treats each sub-period equally regardless of how much cash sat in the account. MWRR does the opposite on purpose. It's supposed to reflect your lived experience as an investor, including the (often costly) habit of adding money at the wrong time.
There's one case where the two numbers converge: if you never add or withdraw money after the initial investment, MWRR and TWR are identical. Cash flow timing only matters once external contributions and withdrawals enter the picture. For a buy-and-hold account with a single initial deposit and no additions, you don't need to worry about which metric to use. They agree.
How Do You Calculate Money-Weighted Return?
The equation behind MWRR looks intimidating the first time you see it, but the concept is simple once you unpack it. You're solving for the rate r that makes this equation true:
Σ [CFₜ / (1 + r)ᵗ] = 0
Every cash flow (CFₜ) gets discounted back to today at rate r, and you're looking for the single r that makes the sum of all those discounted flows equal zero. Contributions you put into the account are negative numbers. Withdrawals and your final ending portfolio value are positive numbers, treated as if you "received" that money back. Get the signs backward and the whole calculation collapses.
There's no algebraic shortcut to isolate r in that equation once you have more than two cash flows. You can't rearrange it the way you would a simple percentage formula. Instead, the rate has to be found by testing values, checking the result, and adjusting: a solver runs through hundreds of guesses in a fraction of a second until it lands on the rate that zeroes out the equation. That's exactly what spreadsheet functions like XIRR and dedicated financial calculators do behind the scenes, which is why manual iteration is impractical for anything beyond a textbook two-flow example.
Before you touch a calculator or a spreadsheet, get your cash flows organized. Skipping this step is where most calculation errors start.
- List every external cash flow with its exact date: contributions, withdrawals, and any transfers in or out.
- Record your beginning portfolio value as a negative flow on day one (treat it as money you invested).
- Record your ending portfolio value as a positive flow on the final date (treat it as money you'd receive if you cashed out).
- Confirm the sign convention is consistent from start to finish.
Two things have to be true for a solver to find an answer:
- You need at least one negative cash flow and at least one positive cash flow. A series of all-negative or all-positive numbers has no rate that solves the equation.
- The dates need to be accurate, not approximate. A deposit recorded on the 3rd instead of the 1st shifts the discounting slightly and changes your result.
Once your flows are clean, you're ready to hand them to a spreadsheet.
How Do You Calculate XIRR in Excel or Google Sheets?
Both Excel and Google Sheets solve the money-weighted return formula for you with one function: XIRR(values, dates, [rate_guess]). You don't need to understand the underlying iteration to use it correctly, but you do need to feed it clean inputs.
- Build a column of cash flow amounts (the "values" array): negative for money going in, positive for money coming out or the final balance.
- Build a matching column of actual calendar dates (the "dates" array), one date per cash flow, in the same order as the values.
- Enter
=XIRR(values_range, dates_range)and press enter. Excel and Sheets will iterate internally and return an annualized rate. - Add an optional third argument, a rate_guess (like 0.1 for 10%), only if the function returns an error or an implausible result. Extreme returns, or cash-flow patterns with several sign changes, sometimes need a nudge to help the solver converge.
If XIRR throws a #NUM! error, check three things first: whether you actually have a mix of positive and negative values, whether every value has a matching date, and whether your dates are formatted as real dates rather than text.
Precision matters more than people expect. XIRR uses actual calendar dates and real day counts, including leap years, so a contribution logged on the trade date versus the settlement date can shift your answer by a small but noticeable amount over a short reporting period. Pick one convention (trade date is standard for most brokerage exports) and stick with it across every flow.
Pro Tip: Online MWRR calculators are fine for a quick sanity check on two or three cash flows, but they get unreliable fast once you have monthly contributions across a multi-year account. Build the spreadsheet once, and reuse the same template every quarter.
Money-Weighted vs. Time-Weighted Return: Which Should You Use?
MWRR and TWR answer two different questions, and mixing them up is the most common mistake finance students make on this topic. MWRR answers "what did my invested dollars actually earn, given when I added or removed them?" TWR answers "how well did the underlying investment strategy perform, independent of my personal cash flow decisions?"
That distinction drives industry practice. Under the Global Investment Performance Standards (GIPS), time-weighted return is the default for comparing investment managers because it isolates skill from the client's deposit and withdrawal timing, which the manager doesn't control. Private funds flip that logic: because the general partner controls when capital calls and distributions happen, IRR (money-weighted return) is the standard reporting metric there, often paired with a multiple like MOIC.
A short scenario shows how far apart the two numbers can drift. Now compare two investors in that same portfolio:
- Investor A puts in $10,000 at the start of the year and adds nothing else. Their MWRR tracks close to the TWR.
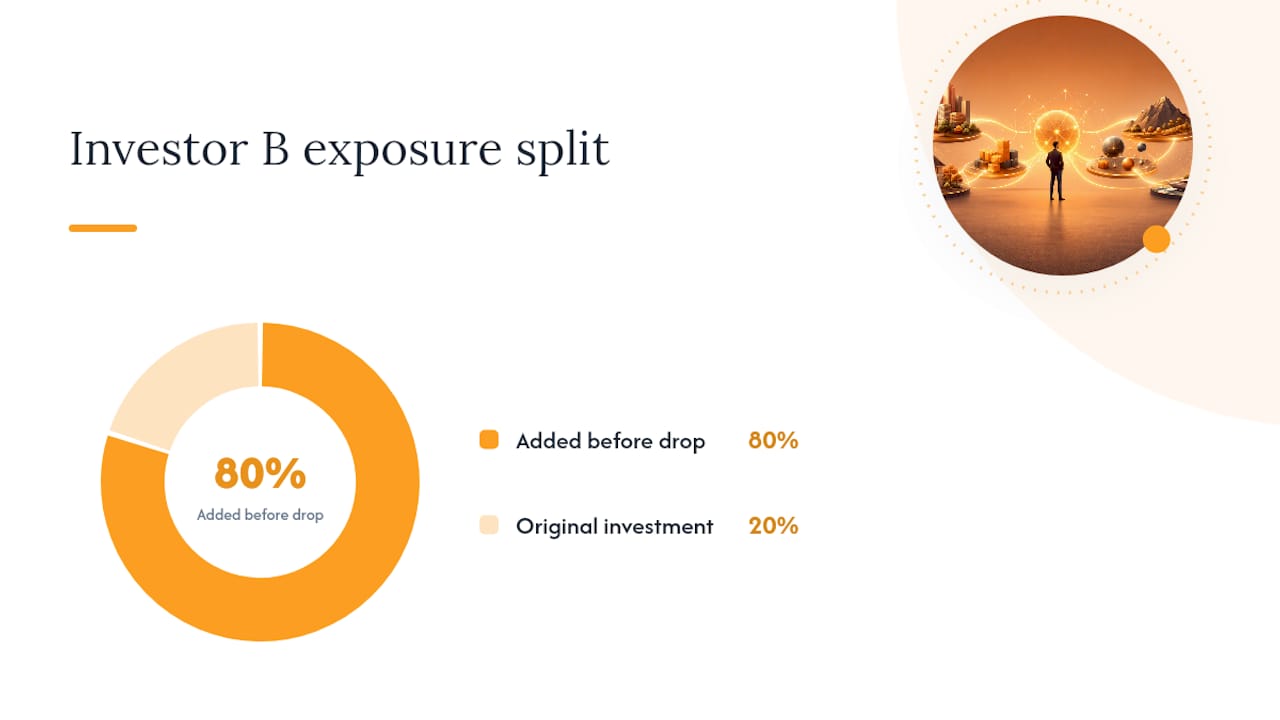
- Investor B puts in $10,000 at the start, then adds another $40,000 right before the 15% drop. Most of their money was exposed to the loss, so their MWRR comes in well below the 2% TWR, even though they held the exact same fund as Investor A.
Same fund, same TWR, very different lived outcomes. That gap is the entire reason MWRR exists.
The practical answer isn't to pick one metric and ignore the other. Family offices and better reporting platforms increasingly publish both TWR and MWRR side by side, because a client wants to know what they personally earned while also wanting a fair read on whether the manager is any good. If your numbers diverge sharply, that gap itself is informative: it usually means your own contribution or withdrawal timing, not manager skill, is driving your results.
What Does Your Money-Weighted Return Actually Tell You?
Your MWRR is most useful as a check against your own planning assumptions. If you built a retirement projection assuming a 7% annualized return and your MWRR since inception is sitting at 4%, that gap is worth investigating before you assume the plan is still on track.
A few things shape how to read the number:
- Contribution timing matters as much as market performance. Dollar-cost averaging into a volatile asset naturally produces an MWRR that differs from the asset's raw TWR, sometimes for the better, sometimes worse.
- Volatility amplifies the timing effect. In a calm, steadily rising market, MWRR and TWR stay close together. In a choppy market, the gap widens fast, exactly when investors are most likely to be adding or pulling money in a panic.
- A persistently low MWRR should prompt a specific action, not vague concern: increase your savings rate, rebalance toward your target allocation, or reassess whether your risk posture actually matches your goal's time horizon.
Pro Tip: If you're writing this up for a class project or a client report, present MWRR and TWR together in one table, then add one sentence explaining the gap. Graders and clients both want to see that you understand why the numbers differ, not just that you can compute them.
What Are the Common Mistakes When Calculating MWRR?
A handful of cash-flow patterns, mostly ones with multiple sign changes over time, can produce more than one mathematically valid IRR. When that happens, XIRR may return a result that technically solves the equation but doesn't reflect anything meaningful about your actual return. Practitioners generally handle this by cleaning the data or splitting the reporting period into shorter windows rather than trying to force a single answer out of an ambiguous cash-flow series.
Most errors, though, are simpler than that. Reversed sign conventions, forgotten dividend reinvestments, and inconsistent valuation dates between your beginning and ending balances are the usual culprits behind an MWRR that looks obviously wrong.
Before you trust a number, run through a short checklist:
- Confirm your cash flow list has a genuine mix of negative and positive values.
- Cross-check your MWRR against a rough TWR for the same period; a wildly different result usually points to a data error, not a real divergence.
- Verify every dividend, interest payment, and fee was captured as its own dated flow.
- Double-check your beginning and ending valuation dates match the actual start and end of your reporting window.
One structural limitation worth remembering: MWRR is not designed for comparing across different investors or fund managers, because cash-flow timing is personal to each account. Two people in the identical fund can post very different MWRRs for reasons that have nothing to do with investment quality.
How Portfolio Trackers Make MWRR Practical
The mistakes above almost always trace back to messy inputs, not bad math. Missing dates, unlogged dividends, and mismatched valuation points are a data problem, and that's exactly the problem automatic account syncing is built to solve. When your brokerage and bank connections feed dated, itemized cash flows straight into your tracker, there's no manual entry step where a transposed date or a missed transfer can quietly throw off your XIRR.
Consolidating stocks, ETFs, crypto, real estate, and less standard holdings into one dashboard also matters more than it sounds. MWRR needs every dividend, sale, and contribution captured with the correct date and sign. Evibe's dividend tracking and multi-asset syncing are built around exactly that requirement, so the inputs behind your performance numbers stay clean without you reconciling five separate account exports by hand.
Should You Track MWRR or TWR? A Practical Rule of Thumb
Use MWRR to answer "am I personally on track?" and TWR to answer "is this strategy or manager any good?" Those are different questions, and conflating them is where most confusion starts.
The cleanest reporting habit is to show both numbers on the same statement, with a line explaining why they differ when they diverge. That single sentence does more to build trust than either number alone.
On cadence: check MWRR quarterly if you're actively contributing or trading, since contribution timing shifts the number more often in an active account. For a passive, long-term buy-and-hold account, an annual review is usually enough. Checking more often than that mostly adds noise, not insight.
— Vincent
Track Your Real Returns Without the Spreadsheet Headaches
The hardest part of computing MWRR by hand isn't the math, it's keeping every dividend, contribution, and withdrawal dated and correctly signed across accounts you're juggling manually. Evibe removes that friction by syncing your brokerage and bank accounts automatically, so the cash flows behind your performance numbers are already clean and date-stamped before you ever open a spreadsheet.

Evibe's ETF tracker and dividend tracker capture the exact inputs MWRR needs, including reinvested dividends and irregular contribution dates that trip up manual calculations. If you want to see your money-weighted and time-weighted returns calculated automatically instead of rebuilding an XIRR formula every quarter, start free with Evibe and connect your accounts — every new account includes 7 days of Premium, broker sync included.
Sources
- Understand Money-Weighted Rate of Return (MWRR) With Simple Examples — Investopedia
- Gipsstandards
- Money-weighted rate of return (MWRR) — Corporate Finance Institute (CFI)
- Money vs Time Weighted Return — WallStreetMojo
This article is general information, not a substitute for advice from a qualified financial advisor. Consult a qualified financial professional about your own circumstances before acting on anything here.
FAQ
Are IRR and money-weighted return the same thing?
Yes. Money-weighted return is mathematically equivalent to your portfolio's internal rate of return; the terms are used interchangeably in most finance texts and apps.
What is TWRR vs. CAGR?
Time-weighted return removes the effect of your deposits and withdrawals to isolate strategy performance, while CAGR (compound annual growth rate) simply smooths a beginning-to-ending value into one annualized rate, without accounting for interim cash flows at all. They can match on a single lump-sum investment but diverge as soon as money moves in or out.
What is the difference between MWR and TWR?
MWR reflects your personal outcome, weighted by how much capital was invested during each period, including your own contribution and withdrawal timing. TWR reflects the underlying strategy's performance as if no external flows ever happened, which is why GIPS treats it as the standard for manager comparisons.
What is a good time-weighted return?
There's no single universal benchmark. A "good" TWR depends on your asset allocation, time horizon, and the market environment during your measurement period, so it's usually judged against a relevant index or benchmark rather than a fixed target number.
Can a tracking app calculate my money-weighted return automatically?
Yes. A portfolio tracker like Evibe that syncs brokerage and bank accounts can generate the dated, signed cash flows MWRR calculations need and compute the rate automatically, avoiding the manual entry errors that most often distort the result.