Dividend Snowball Calculator: Build Passive Income Fast
Unlock financial growth with our dividend snowball calculator. See how reinvesting dividends can turn small payouts into significant income.
Dividend Snowball Calculator: Build Passive Income Fast

TL;DR:
- A dividend snowball calculator models how reinvesting dividends automatically compounds income over time, creating exponential growth. Reinvested dividends buy more shares that generate even higher dividends, accelerating wealth accumulation especially after 15-20 years. Using accurate inputs like dividend growth and reinvestment frequency is crucial to realistic projections and wealth-building success.
A dividend snowball calculator is a tool that models how reinvesting dividends compounds your income over time, turning modest payouts into a self-accelerating income machine. The formal industry term for this process is dividend reinvestment compounding, and it works through a Dividend Reinvestment Plan, or DRIP. Every dividend you receive buys more shares. Those shares pay more dividends. Those dividends buy even more shares. The result is exponential growth rather than linear growth. Yield on cost can realistically reach 10%–20% or more after decades of consistent reinvestment. Knowing how to use a snowball dividend calculator correctly is the difference between guessing at your financial future and planning it with precision.
How does dividend reinvestment create the snowball effect?
The snowball effect in dividend investing works through one core mechanic: dividends buy shares, and shares pay dividends. A DRIP automates this cycle so you never have to manually reinvest. Each quarter or month, your brokerage takes your dividend cash and purchases additional shares at the current market price. Those new shares then generate their own dividends in the next cycle.

The math starts slowly. In the first year on a $10,000 investment with a 3% yield, you earn $300. That $300 buys a fraction of a share. The following year, you earn dividends on $10,300 instead of $10,000. The difference feels small at first. But the compounding curve steepens dramatically after 15–20 years, turning what once felt like a trickle into a meaningful income stream.
Three pillars drive the snowball dividend effect:
- Initial yield: The starting dividend rate on your investment. Higher yield means more cash to reinvest from day one.
- Dividend growth rate: How much the company raises its dividend each year. A 7% annual raise doubles your payout roughly every decade.
- Reinvestment frequency: Monthly reinvestment compounds faster than annual reinvestment because you put capital back to work sooner.
Pro Tip: Focus on dividend growth rate as much as starting yield. A stock yielding 2% with 10% annual dividend growth will often outperform a 5% yielder with no growth over a 20-year horizon.
What inputs do dividend snowball calculators use?
A dividend snowball calculator is only as accurate as the inputs you feed it. Understanding each variable helps you build realistic projections rather than optimistic fantasies.
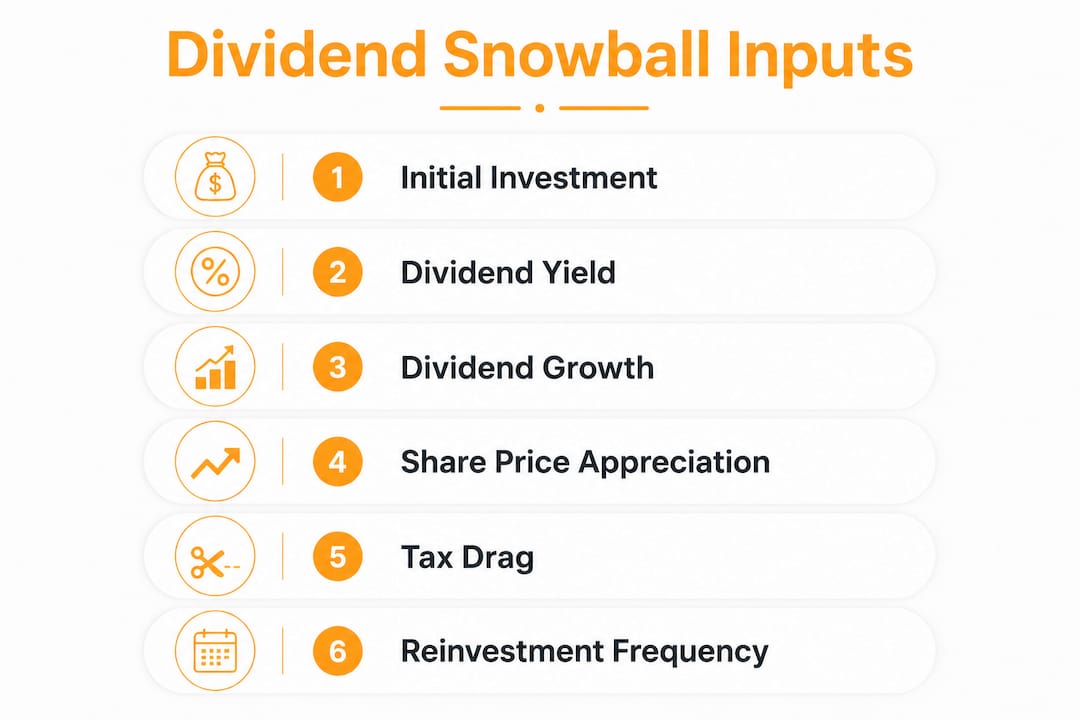
The core inputs are: initial investment amount, dividend yield, annual dividend growth rate, share price appreciation rate, reinvestment frequency, tax rate, and investment timeframe. Each one shifts your outcome materially.
| Input | Low scenario | High scenario | Impact on 10-year return |
|---|---|---|---|
| Dividend yield | 2% | 5% | Higher yield accelerates early compounding |
| Dividend growth rate | 2% | 10% | Growth rate dominates long-term outcomes |
| Reinvestment frequency | Annual | Monthly | Monthly adds meaningful extra shares over time |
| Tax drag | 0% | 30% | Tax reduces net capital available for reinvestment |
| Share price appreciation | 0% | 8% | Boosts total return but not income directly |
A simulated $10,000 investment with 5% dividend growth and 6% share price appreciation achieves 161.7% total return over 10 years with quarterly reinvestment. That result depends on all five inputs working together. Change one, and the projection shifts.
Dividend yields between 2%–4% with consistent dividend growth of 5%–10% annually balance current income and growth potential well for most reinvestment strategies. That range gives you enough starting income to reinvest meaningfully while the growth rate does the heavy lifting over time.
Tax drag is the input most investors underestimate. International investors often face a 15% withholding rate on US dividends, and domestic investors in taxable accounts pay ordinary income or qualified dividend rates. Tax drag reduces the net capital available for reinvestment from the start. Running your projections with and without tax drag shows you the real cost of holding dividend stocks outside a tax-advantaged account.
Frequent reinvestment on a monthly or quarterly basis increases compounding returns by purchasing shares at varied price points, which is especially valuable in volatile markets. A dividend reinvestment calculator monthly setting will consistently outperform an annual setting given the same inputs.
Pro Tip: Always run two scenarios in your snowball dividend calculator: one with your current tax rate applied, and one assuming a tax-advantaged account like a Roth IRA. The gap will tell you exactly how much your account structure is costing you.
How does reinvesting dividends compare to taking cash?
Reinvesting dividends produces exponential portfolio growth. Taking dividends as cash produces linear income. The difference between those two trajectories compounds dramatically over time.
Here is how the two paths diverge over a 20-year period on a $50,000 starting portfolio:
- Year 1: Both approaches generate the same dividend income. The reinvestor buys more shares. The cash taker spends the income.
- Year 5: The reinvestor owns noticeably more shares. Their dividend income is now higher than the cash taker's, even at the same yield.
- Year 10: The gap widens. The reinvestor's yield on cost has grown because their cost basis is fixed while dividends have increased.
- Year 20: Dividend reinvestment approximately doubles total return compared to taking dividends as cash over this timeframe.
Using a DRIP can help investors reach their income target 3–10 years faster than taking dividends as cash. That is not a marginal difference. It is the difference between retiring at 55 versus 65 for many investors.
Yield on cost is the metric that makes this concrete. If you buy a stock at $50 with a $2 annual dividend, your starting yield on cost is 4%. After a decade of 7% annual dividend growth and reinvestment, your yield on cost could exceed 10% on your original investment. The stock still yields 4% to new buyers, but you are earning far more on your original capital.
Taking dividends as cash does make sense in specific situations. Retirees who need income to cover living expenses, investors with high-yield portfolios generating more cash than they need to reinvest, and anyone in a high tax bracket where reinvestment triggers immediate tax liability may all benefit from a hybrid approach. The key is running both scenarios through a dividend growth calculator before deciding.
What strategies maximize your dividend snowball portfolio?
Building a strong dividend snowball portfolio requires more than picking high-yield stocks and hoping for the best. The strategy layer matters as much as the stock selection.
- Enroll in broker-supported DRIPs immediately. Most major brokerages including Fidelity, Schwab, and Vanguard support automated DRIPs with a single click. Automating reinvestment removes the temptation to spend dividends and keeps your compounding uninterrupted.
- Prioritize dividend growth over starting yield. Dividend Aristocrats are S&P 500 companies that have raised dividends for 25 or more consecutive years. They tend to offer lower starting yields but reliable growth, which is exactly what a long-term snowball strategy needs.
- Use accumulating ETFs for tax efficiency. Accumulating ETFs reinvest dividends internally before distribution, which avoids triggering a taxable event on each dividend payment. This approach is particularly powerful in taxable brokerage accounts.
- Hold dividend stocks in tax-advantaged accounts. A Roth IRA or traditional IRA eliminates or defers the tax drag that erodes reinvestment capital in taxable accounts. The compounding benefit is significantly higher when taxes do not interrupt each reinvestment cycle.
- Use your calculator to set concrete income milestones. Rather than running one projection, model multiple scenarios with different contribution amounts and timelines. Set a specific monthly income target, then work backward to find the portfolio size and growth rate required to hit it.
Pro Tip: Use a dividend income tracker alongside your calculator. Seeing real dividend payments grow month over month reinforces the discipline needed to stay invested through market downturns.
Learning how to model investment returns accurately is the foundation of any serious dividend reinvestment plan. Projections that ignore share price volatility, dividend cuts, or tax changes will consistently overshoot reality.
Key Takeaways
The dividend snowball calculator is the most direct tool for projecting how reinvested dividends compound into meaningful passive income over a 10–30 year horizon.
| Point | Details |
|---|---|
| DRIP accelerates income goals | Reinvesting dividends reaches target income 3–10 years faster than taking cash. |
| Tax drag is a real cost | Running projections with your actual tax rate gives accurate, not optimistic, results. |
| Dividend growth beats high yield | A lower yield with strong annual growth outperforms a high static yield over 20+ years. |
| Reinvestment frequency matters | Monthly reinvestment compounds faster than quarterly or annual reinvestment. |
| Yield on cost is the real metric | Consistent reinvestment can push yield on cost to 10%–20%+ on your original investment. |
The patience problem nobody talks about
I have watched investors run a dividend snowball calculator, get excited about the 20-year projection, and then abandon the strategy after 18 months because the early results feel invisible. That is the real challenge with dividend reinvestment. It is not the math. The math is straightforward. The challenge is staying committed when your first year of reinvestment adds up to what amounts to a few extra shares.
The compounding curve is genuinely flat at the start. The first 3 years of a dividend snowball portfolio often feel like nothing is happening. That is not a flaw in the strategy. It is how exponential growth works. The curve only steepens after you have accumulated enough shares for the reinvestment to generate meaningful new share purchases on its own.
What I recommend is a hybrid approach for most investors. Reinvest everything during the accumulation phase, then gradually shift to taking a portion of dividends as cash as you approach your income target. This keeps the snowball growing while giving you a practical off-ramp when you actually need the income. Running this scenario through a dividend income planning tool before you need the cash tells you exactly when to make the switch.
The investors I have seen succeed with this strategy share one trait: they review their projections regularly and adjust their contributions when life changes. The calculator is not a set-it-and-forget-it tool. It is a planning instrument you return to every year.
— Vincent
How Evibe fits into your dividend snowball strategy
Tracking a dividend snowball portfolio across multiple brokerages and asset classes is harder than running the initial projection.

Evibe consolidates your stocks, ETFs, and other assets into one real-time view, syncing automatically from your brokerage accounts. The platform tracks executed, declared, and estimated dividend payments so you can see exactly how your reinvestment is progressing. Evibe's AI-driven analysis flags changes in yield on cost and portfolio risk as your dividend snowball grows. If you want a single place to monitor your full dividend portfolio and measure real progress against your income targets, Evibe is built for that. Track your net worth in real time and see your dividend snowball compound with clarity.
FAQ
What is a dividend snowball calculator?
A dividend snowball calculator models how reinvesting dividends compounds your income over time through a DRIP. It projects portfolio value, dividend income, and yield on cost across a chosen timeframe using inputs like yield, growth rate, and reinvestment frequency.
How much faster does DRIP reach income goals?
Using a DRIP can help investors reach their target passive income 3–10 years faster than taking dividends as cash. The exact difference depends on starting yield, dividend growth rate, and investment timeframe.
Does tax affect dividend reinvestment projections?
Tax drag significantly reduces the net capital available for reinvestment in taxable accounts. International investors often face a 15% withholding rate on US dividends, and domestic investors pay ordinary income or qualified dividend rates on non-qualified dividends.
What dividend yield and growth rate work best for a snowball strategy?
Dividend yields between 2%–4% combined with annual dividend growth of 5%–10% balance current income and long-term growth effectively. This range gives enough starting income to reinvest while the growth rate compounds meaningfully over decades.
When does the dividend snowball start accelerating?
The compounding curve steepens significantly after 15–20 years of consistent reinvestment. Early years feel slow, but the exponential nature of compounding means the growth rate accelerates sharply once a critical share mass is accumulated.