Compute Max Drawdown Correctly: Running Peak, Recovery Gap, and Actions
Use the running peak method to compute your portfolio’s max drawdown, learn how recovery asymmetry raises required gains, and get practical...
Compute Max Drawdown Correctly: Running Peak, Recovery Gap, and Actions

Maximum drawdown is the largest peak-to-trough decline your portfolio has suffered before climbing back to a new high. If you analyze max drawdown correctly, you turn a percentage into a dollar figure you can actually feel, and that number tells you whether your strategy matches your stomach. A 40% drawdown doesn't need an equivalent 40% gain to recover. It requires a significantly larger gain due to recovery asymmetry. That asymmetry is the whole reason this metric deserves your attention before the next downturn, not during it.
TL;DR:
- Calculating max drawdown involves tracking the highest portfolio value, measuring declines at each point, and identifying the largest peak-to-trough drop.
- Different strategies face varying typical drawdowns, with equity portfolios enduring large losses during bear markets and market-neutral approaches maintaining smaller declines.
- A small historical max drawdown on short data samples may be misleading, so examining full-cycle data is crucial before assuming low risk.
- Automating drawdown tracking with tools like Evibe enables real-time risk management, alerts, and diversification insights tailored to your portfolio's actual worst-case scenarios.
Table of Contents
- How Do You Calculate Maximum Drawdown?
- Step-by-Step: How to Compute Drawdown From Your Own Data
- What Counts as an Acceptable Max Drawdown?
- Turning MDD Into Risk-Management Decisions
- A Worked Example: From Peak to Trough to Recovery
- Why This Metric Changes How You Watch Your Portfolio
- Track Max Drawdown Automatically With Evibe
- Sources
How Do You Calculate Maximum Drawdown?
Maximum drawdown (MDD) is defined formally as the largest observed decline from a peak value to the subsequent trough, measured before the portfolio establishes a new peak, according to Investopedia. The math behind it is simple once you see it written out.
The core formula, per Wall Street Prep, is:
MDD = (Trough Value − Peak Value) / Peak Value
Expressed as a running calculation, you track a moving peak P(t), which is the highest value your portfolio has reached up to time t, and compute drawdown at every point as D(t) = (P(t) − x(t)) / P(t), where x(t) is the current value. The maximum of all D(t) values across your history is your MDD.
A few variants trip people up:
- Price vs. accumulated returns. You must convert a returns series into a cumulative wealth index before measuring drawdown, or the timing gets distorted, according to MathWorks.
- Arithmetic vs. log returns. Log returns compound more cleanly over long periods but change the magnitude of intermediate drawdowns slightly.
- The naive high-to-low error. Simply subtracting the lowest point from the highest point in a dataset ignores the running-peak rule and can overstate or misplace the real drawdown window, per GlobalCalcs.
Statistic to remember: a drawdown doesn't count as "maximum" until a new all-time high confirms the trough is behind you. Until then, you're still inside the same drawdown event, no matter how much the portfolio bounces in between.
Step-by-Step: How to Compute Drawdown From Your Own Data
You don't need proprietary software to analyze max drawdown on your own portfolio. A single pass through your data, done correctly, gets you there.
- Build your price series. Start with either daily closing prices or a cumulative wealth index built by multiplying (1 + return) across each period. Never feed raw period returns directly into a drawdown formula.
- Track a running peak. Walk through the series once. At each point, update the peak if the current value exceeds it; otherwise, keep the peak fixed.
- Calculate drawdown at each step. Apply D(t) = (P(t) − x(t)) / P(t) at every data point.
- Record the maximum. Store the largest D(t) value along with the index (date) of the peak and the index of the trough.
- Measure duration and recovery. Count the days from peak to trough (drawdown duration), then from trough to the next new high (recovery time).
This is an O(N) algorithm, meaning it only requires one pass through the data. That's exactly how Matlab's maxdrawdown function works, and it returns both the magnitude and the start/end indices of the drawdown window, per MathWorks, which is useful when you want to pinpoint the exact calendar dates of your worst stretch.
In Excel, this looks like a running MAX formula in one column and a percentage-difference formula in the next. In Python, it's a simple loop or a vectorized cummax() operation followed by a division.
| Step | Formula/Tool | Output |
|---|---|---|
| Running peak | =MAX($A$1:A1) in Excel | Peak value to date |
| Drawdown at t | =(Peak−Price)/Peak | Percent decline |
| Max drawdown | =MAX(drawdown column) | Single MDD figure |
| Duration | Trough date − peak date | Days underwater |
What Counts as an Acceptable Max Drawdown?
Whether your MDD is "bad" depends entirely on what you're holding. A long-only equity portfolio has historically faced steep drawdowns during severe bear markets, while multi-strategy or market-neutral approaches aim for much smaller ones by design, according to BestFolio's drawdown research.
Rough context for common allocations:
- Long-only equity portfolios typically experience sizable drawdowns during major bear markets.
- Balanced stock-bond blends tend to have shallower drawdowns during equity selloffs.
- Market-neutral or multi-strategy approaches aim for relatively low drawdowns.
- Single-stock or crypto holdings can face very large drawdowns in extreme conditions.
Recovery gets exponentially harder the deeper the hole. Here's the math laid out:
Drawdowns require increasingly larger percentage gains to recover, with deeper losses demanding substantially higher gains to breakeven.
That recovery asymmetry is why deeper drawdowns demand exponentially larger gains, a point worth internalizing before you size any position, as noted by FinancialToolset.
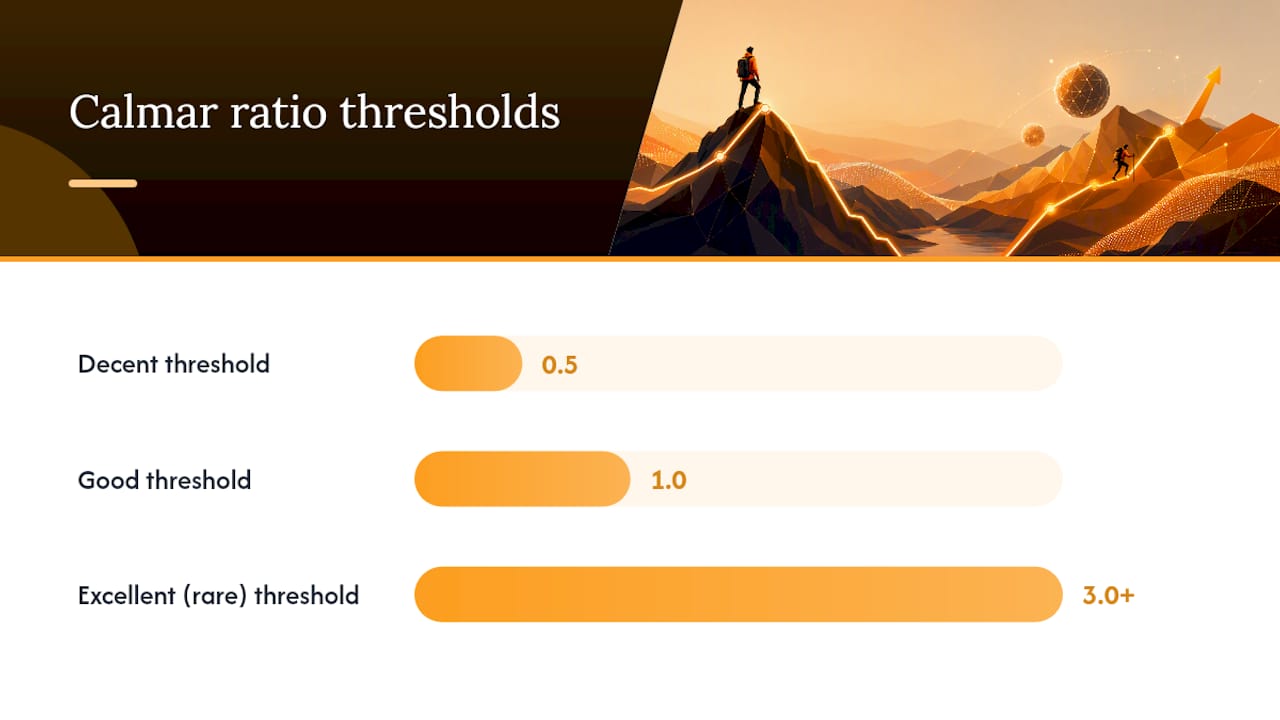
This is where the Calmar ratio earns its place in your toolkit. It's calculated as annualized return divided by the absolute value of max drawdown. Heuristic benchmarks from QuantOracle put anything above 0.5 as decent, above 1.0 as good, and above 3.0 as rare and excellent. Calmar tends to beat Sharpe ratio as your go-to metric when tail risk, not day-to-day volatility, is what actually worries you. Standard deviation can understate real pain because it treats upside and downside swings the same way, while MDD captures the lived experience of watching your account shrink and stay shrunk, according to GlobalCalcs.
Turning MDD Into Risk-Management Decisions
A drawdown number is only useful if it changes what you do next. Here's how to translate it into action.
- Position sizing and leverage. The Kelly criterion offers a mathematical starting point for how much to allocate based on edge and odds, but treat it as a ceiling, not a target. Full Kelly sizing tends to produce drawdowns most investors can't emotionally survive, and overfitting a backtest to minimize historical MDD often just hides risk rather than removing it.
- Diversification with correlation awareness. Adding assets that move independently, not just adding more assets, is what actually narrows your drawdown profile. A correlation matrix shows you where your holdings are secretly moving together.
- Stop-losses and regime filters. These cap downside but introduce whipsaw risk. You'll sometimes sell near a bottom only to watch the market immediately recover, converting a temporary drawdown into a permanent loss.
- Stress testing. Run your portfolio through hypothetical scenarios, not just historical ones. A strategy that survived 2022 might still be exposed to a shock it hasn't seen yet.
Pro Tip: If your backtest shows an unusually small MDD over a short window, be suspicious rather than relieved. A clean multi-year or full-cycle sample almost always reveals a worse number, and that worse number is the one you should plan around.
A Worked Example: From Peak to Trough to Recovery
Say your portfolio peaks at $100,000 in January, then falls to $72,000 by June before starting to recover. Here's how you analyze max drawdown on that path.
- Identify the peak: $100,000.
- Identify the trough: $72,000, the lowest point reached before a new high.
- Apply the formula: ($72,000 − $100,000) / $100,000 = −28%. Your MDD is 28%.
- Calculate the required recovery gain: $100,000 / $72,000 − 1 = 38.9%. You need a 38.9% gain from the trough just to break even, not the 28% you lost.
- Measure duration: if the trough hit in June and the portfolio didn't reclaim $100,000 until the following March, that's a 9-month drawdown and recovery window, often visualized as an "underwater curve" that shows how long the account spent below its prior high.
| Metric | Value |
|---|---|
| Peak value | $100,000 |
| Trough value | $72,000 |
| Max drawdown | 28% |
| Gain needed to recover | 38.9% |
| Time underwater | 9 months |
Tools that report underwater curves, top drawdown events, and gain-to-recover tables, like the calculators from BestFolio, let you paste in your own equity curve and see this same breakdown without building the spreadsheet yourself.
Why This Metric Changes How You Watch Your Portfolio
Investors remember drawdowns the way they remember near misses while driving. The number sticks emotionally in a way average returns never do, and that's exactly why it belongs in every serious risk audit. It's not just a historical curiosity. It's a forward-looking gauge of how much pain you're actually signed up for, and how long you might sit underwater before your accounts feel whole again.
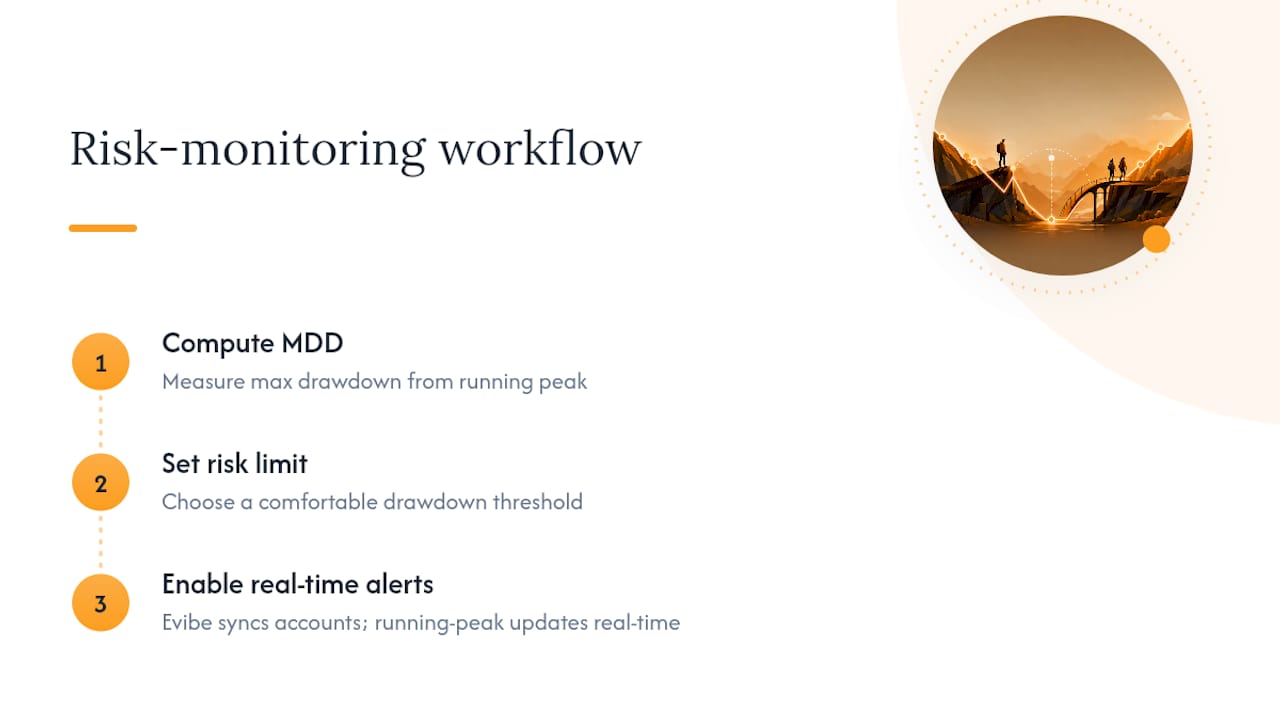
Evibe was built around that idea. It consolidates stocks, ETFs, crypto, real estate, and other assets into a single dashboard, then applies AI-driven analysis to surface risk and diversification patterns you'd otherwise have to calculate by hand. Because it syncs bank and brokerage accounts automatically, the running-peak tracking behind your drawdown number updates in real time, not once a quarter. A sensible workflow: compute your MDD, set a risk limit you're comfortable holding, then let automated alerts tell you when you're approaching it.
— Vincent
Track Max Drawdown Automatically With Evibe
Running the running-peak formula by hand every time the market moves is not a sustainable habit, even for a disciplined investor. Evibe closes that gap by syncing your brokerage and bank accounts automatically and recalculating your portfolio's drawdown in real time, across every asset class you hold rather than one account at a time.

Beyond the core drawdown tracking, Evibe layers in smart alerts when your portfolio crosses a risk threshold you've set, benchmarking against major indices so you can see whether your drawdown is a market-wide event or something specific to your allocation, and dedicated dividend and options tracking for investors who need Greeks and yield data alongside their risk numbers. If your holdings lean heavily on ETFs, the ETF portfolio tracker gives you drawdown and diversification metrics built specifically for fund-based portfolios. Get started free — 7 days of Premium included — and see your actual worst-case number the next time the market gives you one.
Sources
Run your own numbers against more than one source before trusting a single figure. Investopedia and Wall Street Prep both offer clean formula breakdowns and worked examples. For the algorithmic side, MathWorks' documentation shows exactly how a running-peak scan should behave in code. Practitioner calculators like QuantOracle and BestFolio let you paste an equity curve directly and compare their output against your own spreadsheet.
This article is general information, not a substitute for advice from a qualified financial advisor. Consult a qualified financial professional about your own circumstances before acting on anything here.