Compare Implied and Historical Volatility in 4 Steps for Traders
Practical steps for traders: match option horizons, check IV rank and percentile, stress test vega, then confirm sizing before entering any options trade.
Compare Implied and Historical Volatility in 4 Steps for Traders

Implied volatility is the market's forward-looking estimate embedded in option prices; historical volatility measures how much the underlying actually moved in the past. Neither predicts direction. What matters for trading is matching the two to the same time horizon, checking IV rank before you size a position, and understanding your vega exposure before an announcement moves the numbers on you.
TL;DR:
- Matching the implied volatility's horizon to the option’s days to expiration is crucial; mismatched time frames can lead to inaccurate comparisons.
- IV rank and percentile provide context for whether current implied volatility is high or low relative to the asset's recent ranges, guiding premium-selling or buying decisions.
- A significant divergence between HV and IV signals whether the market has priced in future catalysts or simply reflects past movements, impacting trade timing.
- Calculating vega impact before entering trades around events helps avoid unexpected losses caused by IV crush, especially when HV exceeds IV or vice versa.
- Automated tools like Evibe streamline tracking and alerting on IV and HV divergence across multiple positions, helping traders manage volatility exposure efficiently.
Table of Contents
- Implied Volatility vs. Historical: What Each One Actually Measures
- How IV and HV Get Calculated (and Why Horizons Must Match)
- Reading IV in Context: Rank, Percentile, and Event Premium
- Why Vega Turns an IV Move Into a P&L Move
- A Pre-Trade Checklist for Comparing IV and HV
- How Evibe Helps You Track IV and HV Across Every Position
- What Traders Consistently Get Wrong About Volatility Numbers
- Evibe Watches Your Volatility Exposure So You Don't Have To Check Manually
- Sources
- FAQ
Implied Volatility vs. Historical: What Each One Actually Measures
Implied volatility (IV) is a forward-looking, annualized figure that gets backed out of an option's current price using a pricing model. Historical volatility (HV) is the opposite: a backward-looking calculation of how much the underlying's returns actually bounced around over a chosen stretch of time, according to the Options Industry Council.
That distinction changes what each number can tell you.
- IV exists only where options trade. No options market, no IV. It reflects what buyers and sellers are currently paying for uncertainty, not what already happened.
- HV is pure arithmetic. It's derived from closing prices, so it exists for any asset with a price history, options or not.
- A stock can show 25% HV over the past quarter and 45% IV going into earnings. That gap is the market pricing in a catalyst that hasn't happened yet.
- A stock can also show the reverse: high HV from a recent selloff and lower IV once the panic passes, because the market expects things to calm down.
Traders sometimes treat these as interchangeable "volatility numbers." They aren't. One is a memory. The other is a bet.
How IV and HV Get Calculated (and Why Horizons Must Match)
Historical volatility comes from the standard deviation of an underlying's daily log returns over a set window, typically 10, 30, 90, or 180 trading days, then annualized by scaling with the square root of time, per Investopedia's breakdown of implied volatility. Implied volatility works backward: you take an option's actual market price and solve for the volatility input that a model like Black-Scholes would need to produce that price. That makes IV model-dependent. Strike, expiration, and liquidity all affect the number, so two options on the same stock can imply different volatilities even on the same day.
Quick example: if 30-day HV comes in at 22% and a matching 30-day option shows 30% IV, the market is pricing in more movement than the stock has recently shown. That gap alone doesn't tell you which way price will go. It tells you the option is pricing more uncertainty than the recent past supports.
The conversion process traders actually use:
- Pull the annualized IV and HV figures for the same underlying.
- Convert IV to the option's actual horizon using the expected move formula: underlying price × IV × square root of (days remaining ÷ 252), a method Investopedia outlines for scaling annualized figures down to shorter windows.
- Match the HV window length to the option's days to expiration, not to a default 30 or 90 day setting.
The OIC's so-called "Rule of 16" is a shorthand for this: since IV is always quoted annualized, even a 5-day option's IV needs rescaling before you compare it to that option's actual expected move. Skip this step and you'll consistently overstate or understate what an option is really pricing.
Reading IV in Context: Rank, Percentile, and Event Premium
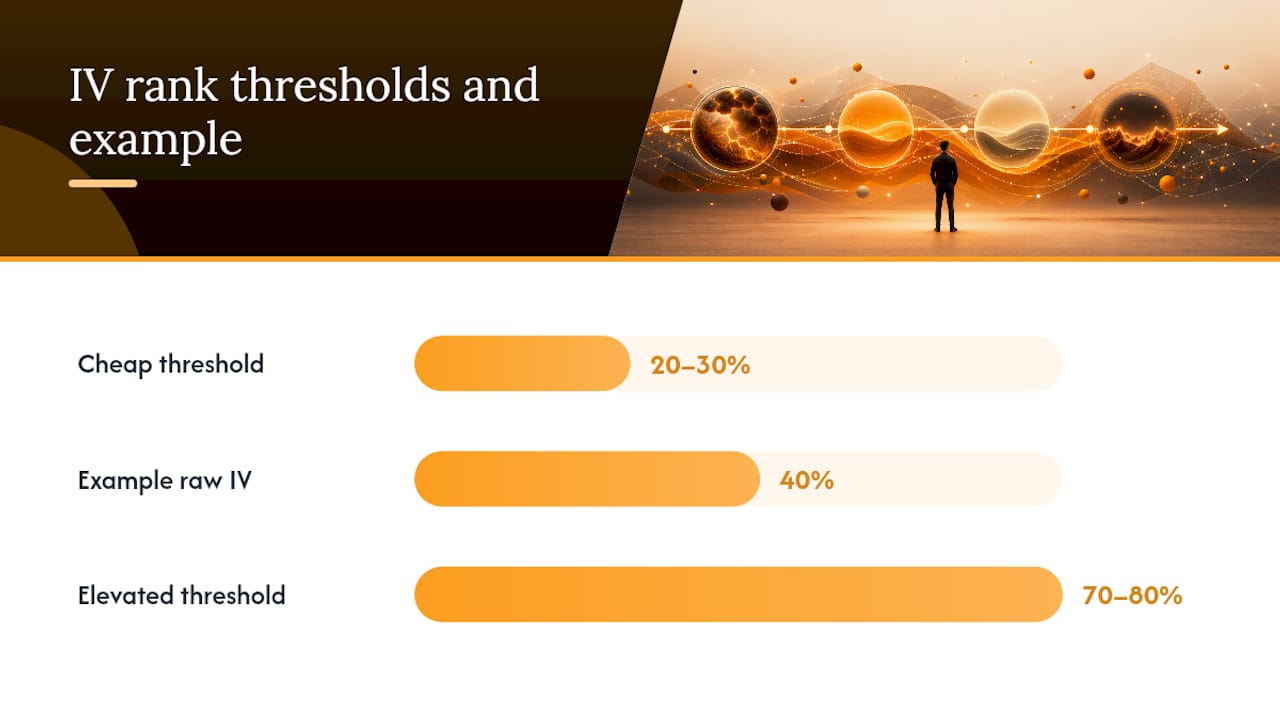
A raw IV number means little without context. A stock sitting at 40% IV could be near a one-year low or a one-year high, and those are completely different setups.
IV rank solves that by placing current IV between its 52-week low and high: (current IV − 1-year low) ÷ (1-year high − 1-year low), a formula the OIC publishes as standard practice. IV percentile takes a different approach, counting what share of the past year's daily IV readings sat below today's level. Experienced traders lean on rank or percentile over the raw figure because identical IV percentages carry different weight depending on each asset's own volatility history.
- An IV rank above 70 to 80% generally signals elevated premium relative to that stock's own recent range, favoring premium sellers.
- An IV rank below 20 to 30% suggests options are comparatively cheap, favoring buyers, assuming the underlying thesis holds.
- Neither threshold is a green light on its own. Skew, liquidity, and event timing still matter.
Event premium is where IV and HV diverge hardest. IV routinely climbs into earnings, an FDA decision, or a macro release because the market is pricing genuine event risk, then collapses right after, a pattern the OIC calls "the crush". HV can't see any of that coming. It only reflects what has already happened, so it stays flat while IV runs up in anticipation.
At the index level, tools like the VOLQ index convert 30-day implied volatility into an annualized figure for the Nasdaq-100, giving traders a market-wide benchmark to compare individual names against, similar to how the VIX functions for the S&P 500.
Why Vega Turns an IV Move Into a P&L Move
Vega measures how much an option's price changes for every one-percentage-point move in implied volatility, independent of any move in the underlying stock. The OIC's guide to volatility and the Greeks shows how this exposure can swing a position's value even when the stock itself sits still.

Here's the trap this sets for directional traders. Say you buy a call ahead of earnings because you're bullish. The stock beats estimates and rises 3%, exactly what you wanted. But IV was sitting at 65% into the print and collapses to 35% once the news is out. If your position's vega exposure was large relative to its delta, the IV crush can erase most or all of the gain from being right on direction.
That asymmetry drives a simple positioning rule:
- When HV sits well above IV, options may be underpricing recent movement, which tends to favor buyers of premium.
- When IV sits well above HV, the market is pricing more movement than has recently occurred, which tends to favor sellers of premium, provided you can tolerate the risk of a real move against you.
Pro Tip: Before entering any options trade around a scheduled event, calculate what the position is worth if IV drops 30 to 40% overnight and the stock doesn't move at all. If that scenario alone breaks your risk tolerance, the position is too large.
A Pre-Trade Checklist for Comparing IV and HV
Skipping this comparison is how traders end up surprised by a "correct" directional call that still loses money. The OIC recommends a structured pass before any trade goes on:
- Identify the option's expiration and pull the HV window that matches those days, not a generic default.
- Normalize both figures to the same horizon, then check where current IV sits using IV rank or percentile.
- Inspect skew, bid-ask spread, volume, and open interest, and flag any earnings date, macro release, or other catalyst inside the option's life.
- Stress-test the position for an IV move in both directions, then set contract size and stop rules before entering.
| Step | What to check | Why it matters |
|---|---|---|
| Horizon match | Expiration date vs. HV window length | Mismatched windows make IV/HV comparisons meaningless |
| Context | IV rank or percentile, not raw IV | Same IV number means different things across assets |
| Market structure | Skew, spread, volume, open interest | Thin liquidity distorts IV and execution costs |
| Stress test | Position value if IV drops or spikes 30% | Reveals vega risk before it becomes a loss |
How Evibe Helps You Track IV and HV Across Every Position
Running this checklist manually across a full options book gets tedious fast. Evibe's options portfolio tracker consolidates your positions and displays Greeks, current IV, and historical return context in one dashboard, synced automatically from your brokerage. Smart alerts flag when IV rank spikes or diverges sharply from an underlying's historical range, so the workflow above becomes an ongoing check rather than a one-time exercise before each trade.
What Traders Consistently Get Wrong About Volatility Numbers
Most traders check IV once before a trade and never look at HV context again. The habit that actually improves decision quality: match horizons, check IV rank, and size for vega before entering, every single time, not just before earnings.
*— Vincent
Evibe Watches Your Volatility Exposure So You Don't Have To Check Manually
Evibe is the tool for traders who want their options exposure visible alongside everything else they own, not siloed in a separate brokerage tab. It pulls positions automatically, surfaces Greeks and IV next to historical price context, and sends smart alerts when volatility readings shift meaningfully across your holdings.

If you're running multiple options positions across accounts, checking IV rank and vega exposure manually before every trade doesn't scale. Evibe's options tracker puts that context in one place automatically, alongside your ETFs, dividends, and every other asset class you hold. The full platform is free to use, with Premium at $9.99 per month or $99.99 per year and no ads or data sales. Every new account starts with 7 days of Premium, so you can see your volatility exposure the next time an alert fires.
This article is general information, not a substitute for advice from a qualified financial advisor. Consult a qualified financial professional about your own circumstances before acting on anything here.
Sources
- Options Industry Council
- SEC — VOLQ methodology (exhibit)
- Investopedia — Implied volatility (IV) article
FAQ
What does 20% implied volatility mean?
It doesn't indicate direction, and it only carries real meaning once compared against that asset's own IV rank or historical volatility.
Can you show me a historical chart of implied volatility?
Most brokerage platforms and options analytics tools plot an underlying's IV history alongside its price, letting you see past IV rank visually. A portfolio tracker like Evibe's options tracker shows current IV alongside historical return data for positions you already hold, though a full multi-year IV chart typically comes from your broker's options analytics.
Is it better to buy options when IV is low or high?
Buying options when IV rank is low generally means paying less time-value premium, which favors buyers if the underlying then makes a real move. Selling options when IV rank is high tends to favor collecting richer premium, provided you can absorb the risk of a larger-than-expected move.
How much IV is considered high?
IV rank and IV percentile solve this by comparing current IV to that specific asset's own one-year range, which is why the OIC recommends using rank over raw IV for this judgment.