Options Greeks Explained: A Practical Trader’s Guide
Master options Greeks explained: Delta, Gamma, Theta, Vega, and Rho, with practical examples to sharpen your trading precision and boost your potential.
Options Greeks Explained: A Practical Trader's Guide

The options Greeks are five sensitivity measures — Delta, Gamma, Theta, Vega, and Rho — that tell you exactly how an option's price responds to changes in the underlying stock, time, volatility, and interest rates. For retail traders, they are the difference between sizing a position with precision and guessing. Every options trade you place carries Greek exposure whether you track it or not.
Here is what you are managing when you trade options:
- Delta: how much the option moves per $1 change in the underlying
- Gamma: how fast delta itself changes
- Theta: how much premium erodes each day from time decay
- Vega: how much the option gains or loses per 1% move in implied volatility
- Rho: sensitivity to interest rate changes (matters most for long-dated positions)
Greeks are partial derivatives from pricing models like Black–Scholes) — mathematically defined, but built on model assumptions. That means they are reliable guideposts, not guarantees. Traders who focus on a single Greek while ignoring the others frequently face unexpected losses, which is why portfolio-level monitoring matters from day one.
Pro Tip: Before placing any options trade, check all five primary Greeks together, not just the one that motivated the trade. A great theta setup can still hurt you if vega is working against you.
Key Takeaways
Understanding options Greeks as a portfolio-level risk dashboard, not a per-contract checklist, is what separates traders who manage risk deliberately from those who discover it after the fact.
| Point | Details |
|---|---|
| Delta drives directional exposure | Multiply delta by 100 and by contracts to get your real share-equivalent exposure per position. |
| Gamma accelerates near expiry | ATM options in the final two weeks carry the highest gamma; re-check delta daily when positions are short-dated. |
| Theta and vega trade off | Long options pay theta daily in exchange for vega upside; short options collect theta but carry IV risk. |
| Monitor Greeks at portfolio level | Aggregate net delta, vega, and theta across all positions; a single-contract view misses the full picture. |
| Evibe tracks Greeks in real time | Evibe's options tracker aggregates Greek exposure across accounts with real-time data and smart alerts. |
Table of Contents
- What does delta actually tell you about an options trade?
- Why does delta keep changing? Understanding gamma risk
- How time decay works and why theta accelerates near expiry
- How implied volatility moves option prices through vega
- What are Rho and the second-order Greeks, and when do they matter?
- How do the Greeks interact, and what does that mean for your portfolio?
- How to use Greeks at order entry and during trade management
- Greeks formulas and calculators quick reference
- Greeks matter more than most retail traders realize
- Track your options Greeks in real time with Evibe
- Useful sources for further reading
What does delta actually tell you about an options trade?
Delta measures the rate of change in an option's price for every $1 move in the underlying asset. Formally, Δ ≈ ∂V/∂S. In plain terms: a call with a delta of 0.50 gains roughly $0.50 in value when the stock rises $1.
Range and sign:
- Call options: delta runs from 0 to +1
- Put options: delta runs from -1 to 0
- Deep in-the-money options approach ±1; far out-of-the-money options approach 0
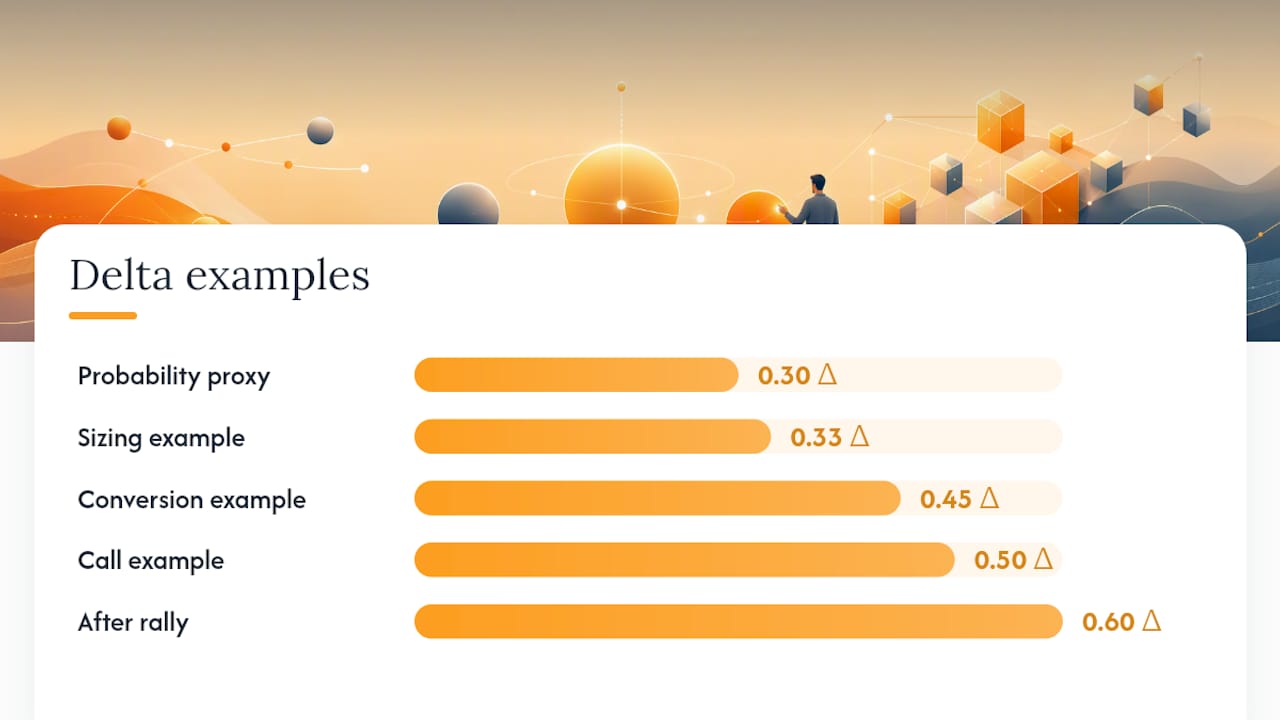
Delta as a probability proxy. A 0.30-delta call is often treated as a rough 30% probability of finishing in the money at expiration. This is a useful shorthand, but it is not the same as a true statistical probability — the Black–Scholes model's risk-neutral probability and real-world probability diverge, especially in volatile markets.
Converting delta to dollar exposure is where it gets practical. Each standard equity option contract covers 100 shares:
- Identify the option's delta (e.g., 0.45 for a call).
- Multiply by 100 (shares per contract): 0.45 × 100 = 45 share-equivalents.
- Multiply by the stock price (e.g., $200): 45 × $200 = $9,000 of directional exposure per contract.
Delta is not a fixed number. It shifts constantly as the stock price moves, time passes, and implied volatility changes. A 0.45-delta call today can be a 0.60-delta call tomorrow after a 5% rally. Treat every delta reading as a snapshot, not a permanent label.
How traders use delta in practice:
- Directional sizing: want $5,000 of exposure to a $150 stock? You need roughly 0.33 delta per contract (5,000 ÷ 150 ÷ 100).
- Delta-neutral hedging: offset a long call's positive delta by shorting shares or buying puts until net delta approaches zero.
- Portfolio delta check: sum all contract deltas (×100 × price) to see your total directional equity exposure.
Pro Tip: Beginners often lock in a delta reading at entry and forget it. Set a reminder to re-check delta any time the underlying moves more than 2–3% — your exposure has already changed.
Why does delta keep changing? Understanding gamma risk
Gamma is the rate of change of delta. If delta tells you where you are, gamma tells you how fast you are moving. Formally, Γ = ∂Δ/∂S — the second derivative of the option price with respect to the underlying.
Gamma is highest for at-the-money options and short-dated contracts. A one-week ATM option can have gamma several times larger than a three-month ATM option at the same strike. That means a $5 move in the underlying shifts delta dramatically for short-dated positions.
A concrete example: You hold an ATM call with delta 0.50 and gamma 0.08. The stock rises $3.
- New delta ≈ 0.50 + (0.08 × 3) = 0.74
Your position went from 50 share-equivalents to 74 — a 48% jump in directional exposure from a single move. That is gamma at work.
What gamma means for hedging:
- High-gamma positions require more frequent re-hedging to stay delta-neutral.
- More frequent re-hedging means more transaction costs and slippage.
- Selling short-dated ATM options (short gamma) collects premium but creates convex risk: losses accelerate as the underlying moves away from the strike.
Signs of elevated gamma risk in your portfolio:
- Multiple short ATM options expiring within two weeks
- Net portfolio gamma that is large and negative (short gamma)
- Positions concentrated near a single strike price
Pro Tip: Check your portfolio's net gamma weekly, and daily in the final week before any expiration. A position that looked manageable at 30 days to expiry can become a liability at 5 days.
How time decay works and why theta accelerates near expiry
Theta measures how much an option's price declines each calendar day, all else equal. For a long option, theta is negative — you are paying for time. For a short option, theta is positive — time decay works in your favor.
Key theta dynamics:
- ATM options carry the highest theta in dollar terms; they have the most time value to lose.
- Theta accelerates as expiration approaches, especially in the final 30 days.
- Far out-of-the-money options have low absolute theta but can lose a large percentage of their remaining value quickly.
A daily decay example: You buy an ATM call for $3.00 with theta of -0.05. After one trading day (all else equal), the option is worth approximately $2.95. After 10 days: roughly $2.50. The decay is not linear — it curves upward as expiry nears.
Managing theta in practice:
- Match your expiration to your thesis timeline. If you expect a move within two weeks, buying a 60-day option wastes premium on time you do not need.
- Sell premium in high-theta environments. Short options with 30–45 days to expiry capture the steepest part of the decay curve.
- Scale position size to your theta budget. If you can tolerate $50/day in decay across your portfolio, size accordingly — not just per contract.
- Watch OTM options near expiry. A $0.10 option with 3 days left can go to zero in a single session.
Pro Tip: Far OTM options look cheap in dollar terms, but their theta-to-premium ratio is often punishing. A $0.15 option losing $0.03/day is burning 20% of its value daily.
How implied volatility moves option prices through vega
Vega measures how much an option's price changes for every 1 percentage point move in implied volatility (IV). It is not a Greek letter, but it behaves like one. A vega of 0.12 means the option gains $0.12 if IV rises 1%, and loses $0.12 if IV falls 1%.
Vega is largest for ATM options and longer-dated contracts, and it shrinks as expiration approaches. A 90-day ATM option has far more vega exposure than a 7-day ATM option at the same strike.
Implied vs. realized volatility: IV is the market's forward-looking expectation of volatility, priced into the option. Realized volatility is what actually happened. When IV is elevated relative to what the stock actually does, option sellers benefit. When IV is low and a big move occurs, option buyers benefit.
A vega example: You hold a long call with vega of 0.15. IV rises from 25% to 30% (a 5-point move). Your option gains approximately 0.15 × 5 = $0.75 in value from vega alone, before any price move in the underlying.
Building a vega strategy:
- Long vega (buy options): profits when IV expands; useful before earnings, Fed announcements, or other binary events.
- Short vega (sell options): profits when IV contracts; works well after events when IV typically collapses.
- Vega-neutral spreads: combine long and short options to reduce net vega exposure while keeping directional or theta exposure.
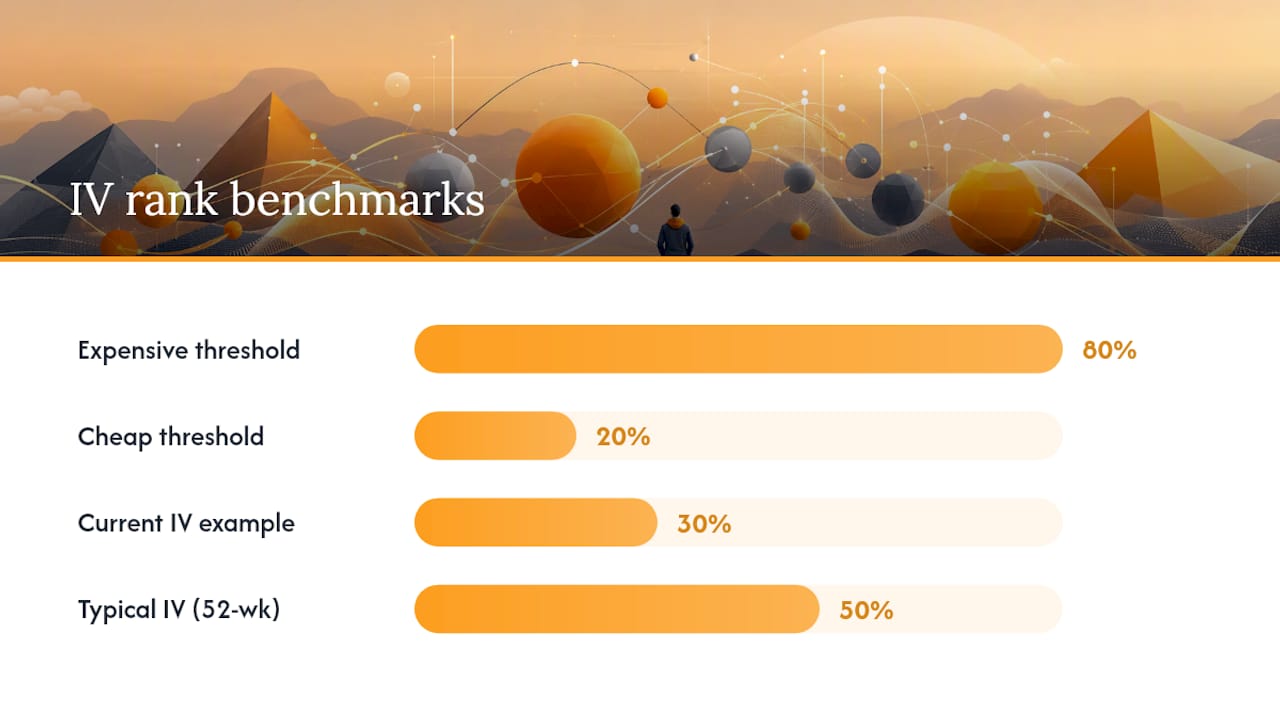
- Check IV rank before entry. Buying options when IV rank is above 80% is expensive; selling when IV rank is below 20% offers thin premium.
Event risk checklist:
- Earnings date within the option's life? Expect an IV spike then crush.
- Fed meeting or macro data release? IV often rises into the event and falls after.
- Is your position long or short vega? Know which direction hurts you.
Pro Tip: Track IV rank (current IV relative to its 52-week range) rather than raw IV. A 30% IV on a stock that normally trades at 50% is actually low — raw IV alone does not tell you whether options are cheap or expensive.
What are Rho and the second-order Greeks, and when do they matter?
Rho measures an option's sensitivity to a 1 percentage point change in interest rates. A call with rho of 0.05 gains $0.05 if rates rise 1%. For short-dated retail trades, rho is typically a minor factor). It becomes meaningful for LEAPS (options with a year or more to expiry) or during periods of rapid rate changes like the 2022–2023 Fed tightening cycle.
Industry practitioners group the following as commonly referenced second-order Greeks:
| Greek | What it measures | Practical relevance |
|---|---|---|
| Vanna | Delta's sensitivity to IV changes | Matters when hedging large positions near earnings |
| Vomma | Vega's sensitivity to IV changes | Used by professionals managing large vega books |
| Charm | Delta's rate of change over time | Relevant for overnight and weekend delta drift |
| Speed | Gamma's rate of change vs. underlying | Useful for managing convexity in large books |
| Veta | Vega's rate of change over time | Tracks how vega decays as expiry approaches |
| Ultima | Third-order sensitivity to volatility | Primarily a professional risk-desk metric |
For most retail traders, vanna and charm are the two worth knowing. Vanna explains why a stock's big IV move can shift your delta even without a price change. Charm explains why your delta drifts overnight, particularly for positions close to expiry.
Pro Tip: You do not need to calculate second-order Greeks manually. What matters is knowing they exist — so when your delta moves more than gamma alone predicts, you understand why.
How do the Greeks interact, and what does that mean for your portfolio?
No Greek moves in isolation. Greeks are interdependent and change throughout the trading day, which is why monitoring them at the portfolio level matters more than checking individual contracts.
The three most important interactions:
- Vega–theta tradeoff: long options are long vega and short theta. You are paying daily decay in exchange for the right to profit from an IV expansion. Short options flip this: you collect theta but carry vega risk.
- Delta–gamma coupling: as the underlying moves, delta changes at a rate determined by gamma. A large move in a high-gamma position can double or triple your directional exposure within a single session.
- IV and delta together: when IV spikes, vega inflates option prices, but vanna also shifts delta. An earnings gap that doubles IV can move your effective delta significantly even before the stock price settles.
A before/after earnings snapshot: Suppose you hold a long call with delta 0.40, vega 0.18, theta -0.06, and gamma 0.05. The stock gaps up 8% on earnings and IV collapses from 60% to 25%.
- Delta rises due to the price move (gamma effect): new delta ≈ 0.40 + (0.05 × 8) = 0.80
- Vega loss from IV crush: 0.18 × 35 = $6.30 per share lost to IV collapse
- Net result: the stock moved in your favor, but IV crush offset much of the gain
Portfolio-level risk management steps:
- Aggregate net delta, gamma, theta, and vega across all open positions weekly.
- Set alert thresholds: if net delta exceeds your target exposure, rebalance.
- Stress-test against a 10-point IV spike and a 5% underlying move simultaneously.
- Before earnings, decide explicitly whether you want to be long or short vega — do not let it happen by default.
Pro Tip: Use a real-time Greek dashboard that shows your net portfolio Greeks, not just per-contract snapshots. Set delta and vega alerts so you know when a position has drifted outside your intended range.
How to use Greeks at order entry and during trade management
A consistent pre-trade and post-entry workflow keeps Greek exposure intentional rather than accidental.
Order-entry checklist:
- Direction check: does net delta match your market view (bullish, bearish, neutral)?
- Vega budget: are you comfortable with the IV sensitivity given upcoming events?
- Theta cost or income: how much daily decay are you paying or collecting?
- Gamma exposure: how fast will delta change if the underlying moves 3–5%?
- Dollar exposure: multiply each Greek by 100 (shares per contract) and by the number of contracts to get real dollar impact.
Three trade examples:
- Long call: dominant exposure is positive delta and positive vega. You need the stock to move up AND/OR IV to expand. Watch gamma near expiry — delta can accelerate quickly.
- Covered call: you are long stock (delta ≈ +1 per 100 shares) and short a call (negative delta, positive theta). Net delta is reduced; you collect theta but cap upside. Monitor vega — the short call is short vega, so an IV spike hurts the position.
- Vertical spread (bull call spread): long lower-strike call, short higher-strike call. Net delta is positive but capped. Vega is near-zero (the two legs offset). Theta is usually slightly negative for debit spreads. Gamma risk is lower than a naked long call.
Platform tips for reading Greeks:
- Most broker platforms (thinkorswim, Tastytrade, Interactive Brokers) display Greeks in the options chain. The per-contract figures need to be multiplied by 100 for dollar impact.
- For real-time options tracking across multiple accounts, an aggregated Greek dashboard removes the manual math.
- Set position-level alerts for delta drift beyond ±0.15 from your entry delta.
Pro Tip: When you convert per-contract Greeks to dollar exposure, the numbers often surprise traders. A vega of 0.20 looks small — but 10 contracts means $200 of exposure per 1% IV move, which adds up fast during volatile periods.
Greeks formulas and calculators quick reference
The primary Greeks derive from the Black–Scholes model as partial derivatives of the option price V with respect to each input:
| Greek | Formula (simplified) | Sign (long position) | Peaks at |
|---|---|---|---|
| Delta (Δ) | ∂V/∂S | + (call), − (put) | Deep ITM |
| Gamma (Γ) | ∂²V/∂S² | + | ATM, short-dated |
| Theta (Θ) | ∂V/∂t | − | ATM, near expiry |
| Vega (ν) | ∂V/∂σ | + | ATM, long-dated |
| Rho (ρ) | ∂V/∂r | + (call), − (put) | Long-dated |
Recommended calculators and tools:
- OptionsEducation options calculator (OIC): free, browser-based, lets you adjust price, volatility, time, and rates to see how each Greek changes in real time. Ideal for learning.
- Interactive Brokers' Trader Workstation: built-in Greek display with real-time updates across the options chain
- Broker-native calculators (thinkorswim's Analyze tab, Tastytrade's trade page) — show Greeks per contract and let you model hypothetical scenarios.
Model outputs are only as reliable as their inputs. Black–Scholes assumes constant volatility and no dividends, among other simplifications. During market stress — a flash crash, a liquidity event, a surprise rate decision — actual option prices can deviate significantly from model-predicted values. Use Greeks as a framework for thinking about risk, not as precise predictions.
Greeks matter more than most retail traders realize
Most beginner content on options Greeks stops at definitions. That is the wrong place to stop.
The real challenge is not learning what delta is — it is building the habit of checking how your Greeks have shifted after a 3% market move, an earnings release, or a Fed announcement. Delta drifts. Gamma spikes. Vega collapses after events. None of that is visible if you only check Greeks at entry.
What we have seen, building Evibe's options tracking features, is that traders who aggregate their Greeks across positions make meaningfully better sizing decisions. Not because they are smarter, but because the information is in front of them. A net-delta dashboard that updates in real time removes the cognitive load of manually summing across five open contracts in three different accounts.
The second-order Greeks — vanna, charm, vomma — are not academic curiosities. They explain the gaps between what your model predicts and what actually happens. You do not need to calculate them by hand. You do need to know they exist so you can recognize when your position is behaving unexpectedly.
Greeks are theoretical tools built on model assumptions, as the OCC's options disclosure materials make clear. They work well under normal conditions and require judgment under stress. The traders who use them best treat them as a live risk map, not a one-time calculation.
Track your options Greeks in real time with Evibe
Knowing your Greeks is one thing. Seeing them update live across every position you hold, across multiple accounts, is where the knowledge becomes useful.

Evibe's options portfolio tracker displays real-time Greeks and expiry calendars for every contract in your portfolio, synced automatically from your brokerage accounts. Net delta, vega, and theta aggregate across positions so you see your true exposure at a glance, not contract by contract. Smart alerts notify you when a Greek drifts past your threshold, so you catch position changes before they become problems. Evibe is free to use, and every new account gets 7 days of Premium directly in the iOS or macOS app. If you are actively trading options and want a cleaner picture of your Greek exposure, get started free at evibe.com.
Useful sources for further reading
The resources below are the most reliable references for formulas, calculators, and deeper study on options Greeks:
- What Are Options Greeks & How to Use Them?
- Options Trading Decoded: 5 Key 'Greeks' You Must Understand
- Introduction to Options – The Greeks | Trading Lesson
- Options calculator — OptionsEducation (The Options Industry Council)
- What are Option Greeks? | Optiver
- Options Disclosure Document — The Options Clearing Corporation (OCC)
A note on model outputs: every calculator above uses Black–Scholes or a variant. The outputs are only as accurate as the inputs you provide. Use them to understand relationships and test scenarios, not to generate trading signals. When market conditions are unusual, trust your judgment alongside the numbers.
This article is general educational information, not financial or investment advice. Confirm current rules and suitability with a qualified financial professional before trading options.