Investors: 5 Step Method to Choose a Blended, Investable Benchmark
Build an investable blended total return benchmark in five steps. Use an institutional checklist, map ETFs to your allocation, and track it with portfolio...
Investors: 5 Step Method to Choose a Blended, Investable Benchmark

Pick an investable, total-return benchmark that mirrors your portfolio's actual allocation, or build a weighted blend that does. This preserves the meaning of alpha, beta, and every other risk metric you calculate. The GIPS standards require total-return benchmarks for a reason: a portfolio holding stocks, bonds, and cash compared against a stock-only index will always look wrong. A portfolio tracker can help you track that blend once you've built it.
TL;DR:
- Using a blended, total-return benchmark that reflects your actual asset allocation enhances the accuracy of performance metrics like alpha and beta.
- Building your benchmark involves mapping each portfolio sleeve to investable, measurable indexes and combining them based on your target weights.
- Ensure your benchmark is chosen before performance measurement, appropriate, unambiguous, and reflects your actual investments to avoid misleading results.
- Regularly review and update your benchmark whenever your allocation drifts or a better index becomes available; automate tracking to maintain consistency.
- Comparing your portfolio against an investable, total-return blended benchmark over the long term provides meaningful insights, while short-term deviations should be treated as noise.
Table of Contents
- What Is an Investment Benchmark, and Why Does It Matter?
- Types of Benchmarks Investors Can Use
- Seven Properties of a Valid Benchmark (Practical Checklist)
- Step-by-Step Method to Choose or Build Your Benchmark
- How to Interpret Benchmark Comparisons: Key Metrics Explained
- Common Mistakes, Red Flags, and When to Change Your Benchmark
- How Tools and Tracking Help You Hold Your Benchmark Accountable
- Considerations for Short-Term vs. Long-Term Benchmarking
- Impact of Benchmark Choice on Fees and Incentives
- Benchmarking Alternative Investments and Illiquid Assets
- Using Multiple Benchmarks or Sub-Benchmarks Within a Portfolio
- Author Perspective and Next Steps
- How Evibe Helps You Track the Benchmark You Build
- Sources
- FAQ
What Is an Investment Benchmark, and Why Does It Matter?
A benchmark is the reference portfolio or index you use to judge whether your own results are good, mediocre, or bad. With one, it becomes a verdict: you beat the market, matched it, or lagged behind after fees.
Fidelity's definition frames it simply. A benchmark is a standard against which you measure performance, and the most familiar examples are broad market indexes like the S&P 500, the Russell 3000, or the MSCI ACWI.
Benchmarks are not the same as absolute targets. A total-return index benchmark measures you against what the market actually did. Both have a place, but they answer different questions: one asks "did I beat the market," the other asks "did I meet my personal financial need."
Benchmarks also do quiet mathematical work behind the scenes. Alpha, the excess return you generated, is calculated relative to a benchmark. Beta, your sensitivity to market swings, is measured against one too. Performance attribution, the process of figuring out which decisions helped or hurt your returns, is meaningless without a fixed comparison point. Get the benchmark wrong, and every one of those numbers lies to you.
Types of Benchmarks Investors Can Use
Not every benchmark fits every portfolio, and the biggest mistake individual investors make is grabbing the S&P 500 because it's the one they hear about on the news. Here's how the main categories break down:
- Broad market indexes like the S&P 500, Russell 3000, or MSCI ACWI work well for a portfolio that is genuinely all domestic large-cap equity, or all global equity, respectively. They fail badly the moment bonds, cash, or international exposure enter the picture.
- Style and sector indexes (small-cap value, technology sector, emerging markets) suit a single sleeve of your portfolio, not the whole thing. Use them to judge one holding, not your total net worth.
- Blended or custom benchmarks combine multiple indexes at weights matching your actual allocation, such as 70% equity and 30% bonds. This is the standard fix for any multi-asset portfolio, and it's usually simple to replicate with a handful of low-cost ETFs.
- Absolute-target benchmarks (CPI+4%, a fixed 7% annual return) measure progress toward a personal goal rather than market performance. They're useful for retirement planning but tell you nothing about whether your manager, or you, actually added value.
- Peer-group benchmarks compare you against other investors or fund managers with a similar strategy. They sound intuitive, but peer universes often suffer from survivorship bias and self-reporting problems, which makes them far less reliable than an investable index.
Seven Properties of a Valid Benchmark (Practical Checklist)
The CFA Institute and the GIPS guidance on benchmarks both point to the same set of properties, and they translate directly into questions you can ask about any candidate benchmark before you commit to it.
- Specified in advance. You should choose the benchmark before the performance period starts, not after you see how your portfolio did. Picking a benchmark retroactively because it happens to make your returns look good defeats the entire purpose.
- Appropriate. The benchmark's risk and composition should resemble your own. A benchmark full of small-cap biotech stocks is not appropriate for a conservative dividend portfolio.
- Measurable. Can you calculate its return on any given day? Most published indexes qualify; a hand-picked list of "comparable funds" usually does not.
- Unambiguous. The constituents and their weights should be clearly identifiable, not a vague description like "a mix of growth stocks."
- Representative. It should reflect the areas of the market you actually invest in, not adjacent ones.
- Accountable. Someone should own responsibility for the benchmark's construction and any changes to its methodology, typically the index provider.
- Investable. You must be able to actually buy the components, usually through an index fund or ETF, rather than a theoretical construct nobody can replicate.
GIPS adds one more requirement worth treating as a rule rather than a suggestion: the benchmark should reflect total return, meaning dividends and interest are reinvested, not just price movement.
Verification is quick in practice. Check whether an ETF exists that tracks the index, confirm it prices daily, and read the provider's published methodology to make sure nothing is discretionary or opaque.
Pro Tip: Search for the phrase "total return" in the index or ETF name or fact sheet before you adopt it as a benchmark. A price-only index can understate real market performance by several percentage points a year once you account for reinvested dividends.
Step-by-Step Method to Choose or Build Your Benchmark
This is the part institutional managers do as a matter of course and most individual investors skip entirely. It takes less time than you'd think.
- Define your mandate and target allocation. Write down what you actually hold and why: 60% US equity, 30% international, 10% bonds, for example. This single step eliminates most benchmarking errors before they happen.
- Map each sleeve to a candidate index or ETF. Domestic equity might map to the S&P 500 or Russell 3000. International might map to MSCI ACWI ex-US. Bonds might map to the Bloomberg U.S. Aggregate. Cash maps to a Treasury bill index or money market rate.
- Run each candidate through the seven-property checklist from the previous section. Eliminate anything uninvestable, ambiguous, or unmeasurable.
- Build a weighted blended total-return benchmark. Say your portfolio targets 60% US equity and 40% bonds. You'd combine 60% of the S&P 500 Total Return Index with 40% of the Bloomberg U.S. Aggregate Total Return Index. If the S&P 500 TR returns 12% and the Aggregate TR returns 4% over a period, your blended benchmark return is (0.60 × 12%) + (0.40 × 4%) = 8.8%. That's the number your actual portfolio needs to beat.
- Document it in a written investment policy statement, and set a review cadence, typically annual, or triggered by a genuine change in your allocation or goals.
A few things make this process go smoother:
- Use ETF proxies rather than the raw index itself; you can't buy an index directly, but you can buy SPY, TOO, AGG, or similar funds that track it closely.
- Recalculate blended weights whenever you rebalance, since drifting allocations quietly turn last year's benchmark into a poor fit.
- Keep the math simple. A two- or three-index blend captures most of the benefit; chasing a six-index blend for precision usually isn't worth the added complexity.
How to Interpret Benchmark Comparisons: Key Metrics Explained
Once you have a benchmark, the numbers you calculate against it only mean what the benchmark allows them to mean.
Alpha is your excess return over the benchmark. A portfolio that returns 10% against an 8% benchmark has 2% of alpha, but that number evaporates or inflates depending entirely on which benchmark you picked. The same metrics apply across benchmarking methodology regardless of asset class.
Beta measures how sensitive your portfolio is to benchmark movements.
Sharpe ratio adjusts return for volatility, letting you compare a bumpy 12% return against a smooth 9% one on equal footing.
Tracking error shows how far your returns deviate from the benchmark over time. A high, persistent tracking error usually means your benchmark no longer fits your actual holdings.
Here's a quick worked example. But if that portfolio's standard deviation is double the benchmark's, the Sharpe ratio may actually look worse once you adjust for the extra risk taken to get there. Alpha without a risk-adjusted check is only half the story.
Common Mistakes, Red Flags, and When to Change Your Benchmark
The single most common error is benchmarking a diversified, multi-asset portfolio against a single-asset index, usually the S&P 500, because it's the number everyone quotes. Morningstar's guidance is direct on this point: it's often simply inappropriate and it distorts every conclusion you draw from the comparison.
Other frequent mistakes include:
- Choosing an uninvestable or hand-built benchmark that sounds reasonable but can't actually be replicated with real securities.
- Relying on price-only indexes instead of total-return versions, which understates the real bar your portfolio needs to clear.
- Selecting the benchmark after the fact, once you already know how your portfolio performed.
Watch for these red flags in your ongoing diagnostics: a beta that sits persistently far from 1 relative to what you'd expect, a systematic bias in tracking error that never reverts, or an index provider that won't disclose its methodology in detail.
Update your benchmark when your mandate changes, when your allocation drifts meaningfully from its original target, or when a better, more investable index becomes available for a sleeve you previously approximated.
How Tools and Tracking Help You Hold Your Benchmark Accountable
Building a blended benchmark on paper is the easy part. Tracking it correctly, month after month, across FX conversions and reinvested dividends, is where most individual investors quietly give up.
A multi-asset tracker automates the parts that are tedious to do by hand:
- Consolidating stocks, ETFs, crypto, and other holdings into one live view instead of five separate logins.
- Handling FX conversions automatically when you hold international assets alongside domestic ones.
- Accounting for dividends and total return rather than price alone, which keeps your benchmark comparison honest.
- Calculating your blended benchmark return continuously, rather than you rebuilding a spreadsheet every quarter.
That automation matters less for the math and more for the time it frees up. Evibe's benchmarking tools let you track your portfolio against major indices in real time, so the strategic review you should be doing annually doesn't get pushed aside by the manual bookkeeping that usually eats the time first.
Considerations for Short-Term vs. Long-Term Benchmarking
A benchmark that makes sense over ten years can be actively misleading over three months, and the horizon you're actually investing on should shape which one you pick.
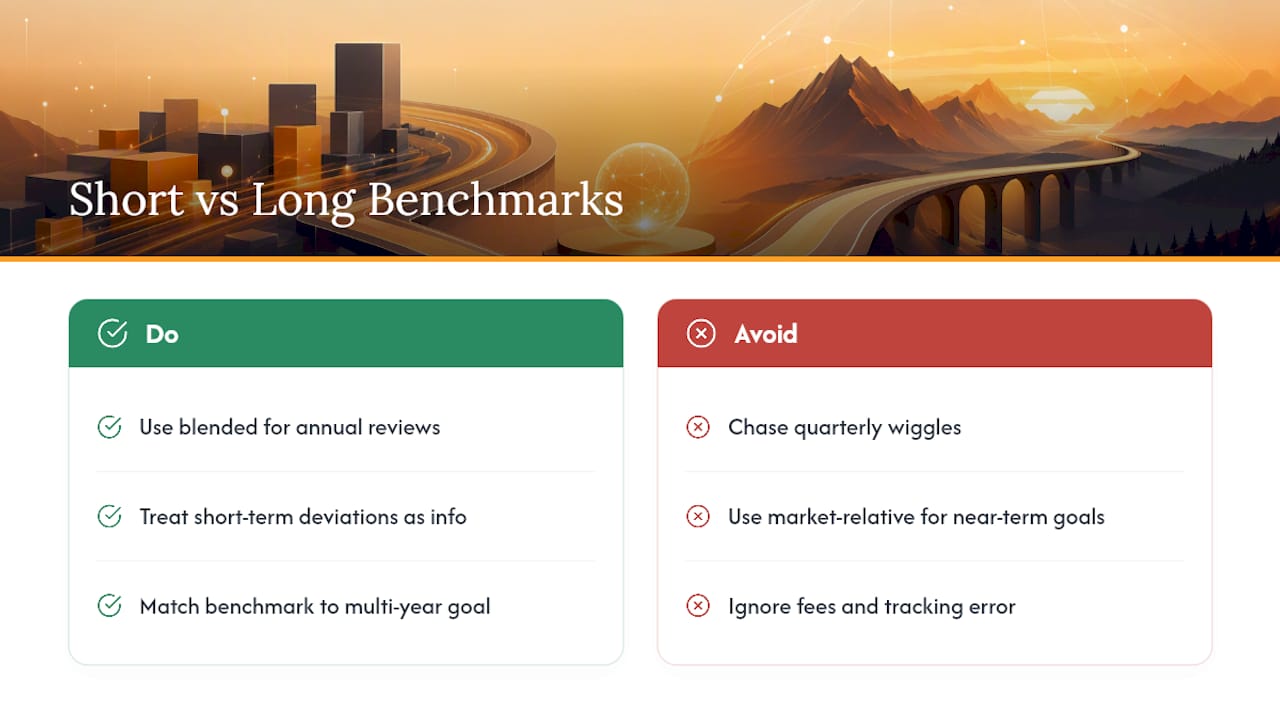
Short-term comparisons, anything under a year, tend to be noisy no matter what benchmark you choose. A blended benchmark built from equities and bonds can swing several percentage points in a quarter purely on interest-rate moves that have nothing to do with your decisions. Treat short-term deviations as information, not verdicts. A month of underperformance against your blend rarely justifies changing strategy.
Long-term benchmarking, five years and beyond, is where a well-constructed blended total-return benchmark earns its keep. Over that horizon, allocation decisions dominate results far more than security selection does, so your benchmark's mix matters more than its precision. This is also the horizon where fees and tracking error compound into real, visible gaps if left unchecked.
The practical rule: use your blended benchmark for annual reviews and multi-year strategy checks, but don't chase every quarterly wiggle against it. If you're saving for a goal five or more years out, your benchmark should reflect where your allocation is headed, not just where it sits today. Investors nearing a shorter horizon, retirement in two years, a home purchase next year, should shift toward an absolute-target or capital-preservation benchmark instead, since a market-relative comparison stops being the relevant question.
Impact of Benchmark Choice on Fees and Incentives
Benchmark choice isn't just an analytical exercise. It directly shapes what you're willing to pay for management, and it can quietly reward the wrong behavior if you're not paying attention.
If your benchmark is a passive index fund charging a fraction of a percent in fees, any active manager or strategy you pay more for needs to clear that low bar plus their own fee just to break even with you. This is precisely why an appropriate, investable benchmark matters for fee evaluation, not just for bragging rights.
Benchmark choice also shapes incentives when a benchmark is used to calculate performance fees, which is common in hedge funds and some managed accounts. A manager benchmarked against an easy-to-beat or inappropriate index has every incentive to keep that benchmark in place, since it inflates the "alpha" that triggers their fee. An investable, properly matched benchmark removes that incentive to game the comparison.
For individual investors managing their own portfolios, the practical takeaway is simpler: compare your all-in costs, expense ratios, advisory fees, trading costs, against what a comparably weighted index fund blend would cost.
Benchmarking Alternative Investments and Illiquid Assets
Real estate, private equity, art, collectibles, and other illiquid holdings resist standard benchmarking because they don't trade daily and often lack a clean public index.
The practical workaround is to use a proxy rather than searching for a perfect match. Real estate holdings can be benchmarked against a public REIT index, even though direct property ownership and REIT shares behave somewhat differently in the short term. Private equity is sometimes compared against a small-cap value index plus an illiquidity premium, acknowledging upfront that the comparison is approximate rather than precise.
Illiquid assets also break the "measurable" property from the seven-property checklist, since you often can't get a real-time market price. Many investors substitute periodic appraisals, purchase price plus estimated appreciation, or a relevant public market proxy, and simply flag those valuations as estimates rather than treating them with the same confidence as a daily-priced ETF.
The honest approach is to segment your portfolio. Benchmark your liquid, publicly-traded sleeve with a precise blended total-return index, and treat illiquid holdings with a looser, clearly-labeled proxy benchmark rather than forcing everything into one number that implies more precision than the underlying data supports. Trying to build one seamless benchmark across liquid and illiquid assets usually produces a false sense of accuracy. Two honest, separately-labeled numbers beat one misleading combined figure.
Using Multiple Benchmarks or Sub-Benchmarks Within a Portfolio
A single blended benchmark works well for judging your total portfolio, but it can hide problems at the sleeve level. This is where sub-benchmarks earn their place.
Aggregate TR, you can still assign each individual sleeve its own benchmark for a closer look. Your US equity holdings get measured against the S&P 500 alone. Your bond holdings get measured against the Aggregate alone. This structure lets you isolate exactly where you're adding or losing value, rather than a blended number masking a strong equity performance offset by a weak bond selection, or vice versa.
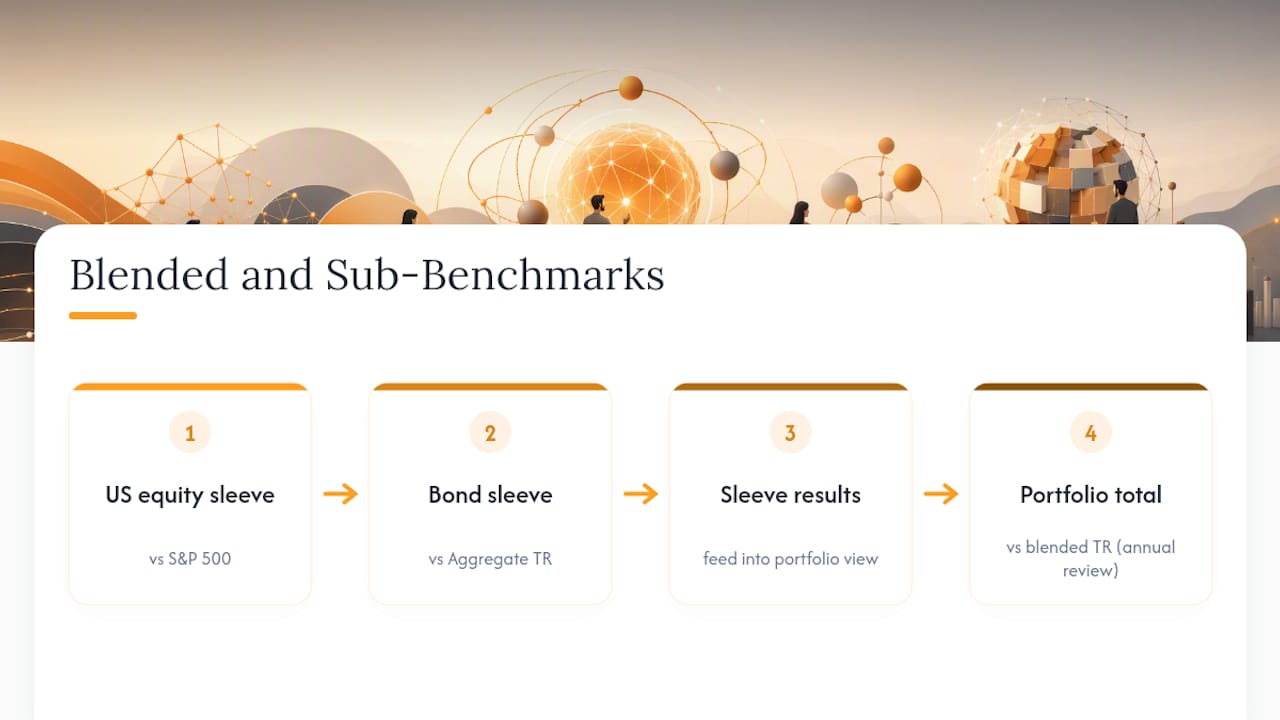
The main risk with multiple benchmarks is complexity for its own sake. Adding a sub-benchmark for every individual holding turns a useful diagnostic tool into a spreadsheet nobody actually reviews. A reasonable structure keeps it to three or four sub-benchmarks matching your major sleeves, plus the one blended total-return benchmark that represents your whole portfolio.
Use the blended benchmark for your annual strategic review and the sub-benchmarks when something in your total return looks off and you need to find the source. That division of labor keeps the system useful without turning benchmark maintenance into a part-time job.
Author Perspective and Next Steps
The right benchmark isn't the famous one. It's the boring, investable, total-return blend that actually matches what you hold, built from ETFs you can buy this afternoon and documented so you're not relitigating the choice every time your portfolio has a rough quarter. Run the five-step method this week: define your allocation, map it to indexes, check it against the seven properties, build the blend, and write it down. Schedule the annual review now, before you forget.
— Vincent
How Evibe Helps You Track the Benchmark You Build
A blended benchmark only stays useful if someone actually recalculates it every time your allocation shifts or a dividend gets reinvested, and that's the part most people quietly abandon by month three. Evibe consolidates stocks, ETFs, crypto, real estate, and other holdings into one dashboard, syncs your bank and brokerage accounts automatically, and lets you track performance against major indices without rebuilding a spreadsheet every quarter.

AI-driven insights can flag risk and diversification shifts as they happen, and smart alerts can notify when your actual allocation has drifted far enough from your target that your original benchmark blend no longer fits. If you hold dividend-paying positions, the dividend tracker accounts for reinvested income automatically, keeping your total-return math honest instead of understated. Evibe itself is free to use, with a Premium subscription for the advanced analytics and no ads or data selling. Start free and build your first blended benchmark this week.
Sources
The benchmarking framework in this article draws on established industry standards rather than informal convention.
- Guidance Statement: Benchmarks for Firms (GIPS)
- What is a benchmark? How does benchmarking work? | Fidelity
- How to Benchmark Your Portfolio | Morningstar
This article is general information, not a substitute for advice from a qualified financial advisor. Consult a qualified financial professional about your own circumstances before acting on anything here.
FAQ
What Is a Good Benchmark for Investments?
A good benchmark is investable, measurable, and matches your actual asset allocation rather than a single popular index. For most diversified portfolios, that means a blended total-return benchmark built from index ETFs weighted to mirror your holdings, not a bare S&P 500 comparison.
What Is Warren Buffett's 70/30 Rule?
It functions less as a rigid rule and more as an example of a blended benchmark: two investable, total-return indexes weighted to match a target allocation.
Is Benchmark Capital a Legitimate Company?
Benchmark Capital is a real, established venture capital firm and has no connection to the investment benchmarking concepts, indexes, or standards discussed in this article. The word "benchmark" in investing refers to a performance comparison tool, not any specific company.
What Does Investment Benchmark Mean?
An investment benchmark is a reference portfolio or index used to evaluate how well your own investments performed. The GIPS standards require that benchmarks used in formal performance reporting reflect total return and be specified in advance, so the comparison stays fair and unambiguous.
How Much Does Evibe Cost?
Evibe is free to use: the Free plan covers one portfolio of up to 50 holdings. Premium costs $9.99 per month or $99.99 per year, and every new account starts with 7 days of Premium before anything is billed. No ads, and the subscription is managed directly through the Apple App Store.