Sharpe vs Sortino: Which Ratio Should Investors Use?
Sharpe vs Sortino ratio: discover which risk-adjusted return metric fits your investment strategy best, and how each evaluates risk and reward differently.
Sharpe vs Sortino: Which Ratio Should Investors Use?

Use the Sharpe ratio when you need a fast, standardized measure of return per unit of total risk. Use the Sortino ratio when you specifically care about downside risk and your strategy has an asymmetric return pattern, like options selling or trend-following. For most diversified, index-style portfolios, the two ratios track each other closely enough that the choice barely moves your conclusion, according to CAIA Association's research. Where they diverge is exactly where it matters most: tail-risk strategies and skewed return streams.
- Diversified index portfolios: Sharpe is usually sufficient.
- Options-heavy or tail-risk strategies: Sortino catches what Sharpe misses.
- Manager fact-sheet screening: compute both, since William F. Sharpe's original framework and modern downside-risk methods answer different questions.
Quick fact: Sharpe and Sortino rankings correlate highly across managers in most datasets, per CAIA's analysis, but skewed strategies are the exception that breaks that pattern. Tools like Evibe that consolidate your return history make either calculation far less error-prone.
Key Takeaways
Sharpe and Sortino usually agree closely, but skewed or tail-risk strategies need Sortino's downside-only lens to avoid a misleading Sharpe reading.
| Point | Details |
|---|---|
| Default to Sharpe | Use it for diversified, roughly symmetric return streams where simplicity and comparability matter. |
| Switch to Sortino for skew | Options-heavy, tail-risk, or asymmetric strategies need downside deviation to expose hidden risk. |
| Match frequency in annualization | Always scale the numerator and denominator with the same conversion, such as sqrt(252) for daily data. |
| Never use one ratio alone | Pair either metric with maximum drawdown and a distribution check before acting on it. |
Table of Contents
- Sharpe Ratio Explained vs Sortino Ratio: Formulas and Inputs
- What Do Sharpe and Sortino Actually Measure?
- Strengths and Limitations of Each Ratio
- How Do Sharpe and Sortino Diverge in Practice?
- Should You Use Sharpe or Sortino for Your Strategy?
- How to Calculate Sharpe and Sortino in Excel, Python, and R
- Do More With Your Portfolio Data
- Sharpe vs Sortino: Which Risk-Adjusted Ratio Should Investors Use?
- Sources
Sharpe Ratio Explained vs Sortino Ratio: Formulas and Inputs
The Sharpe ratio divides excess return by total standard deviation: (Rp − Rf) ÷ σp, where Rp is portfolio return, Rf is the risk-free rate, and σp is the standard deviation of all returns, according to Investopedia's comparison of the two metrics. Every data point counts, both gains and losses.
The Sortino ratio swaps the denominator: (Rp − MAR) ÷ downside deviation. MAR stands for minimum acceptable return, a threshold you set (often 0% or the risk-free rate) representing the return below which volatility actually hurts you. Downside deviation only counts returns that fall below MAR, squaring those shortfalls and taking the root, a method also called a lower partial moment.
Annualization trips up more analysts than the formulas themselves.
- Daily returns: multiply the mean by 252 and the standard deviation by the square root of 252.
- Monthly returns: multiply the mean by 12 and the standard deviation by the square root of 12.
- Match the numerator and denominator frequency. Never annualize one and leave the other in raw monthly terms.
- Use sample standard deviation (n-1 in the denominator), the default in Excel's STDEV.S and most finance libraries, not population standard deviation.
- Arithmetic mean returns are standard for both ratios; geometric returns understate volatility's numerator and will skew your result if mixed in.
What Do Sharpe and Sortino Actually Measure?
Sharpe answers one question: how much excess return did you earn per unit of total volatility, counting upside swings as risk right alongside downside ones? That assumption made sense when Sharpe first formalized the ratio for differential, zero-investment returns, not necessarily for judging a single fund's track record in isolation, as Sharpe's own writing makes clear.
Sortino answers a narrower, arguably more intuitive question: how much excess return per unit of downside volatility, ignoring the upside swings investors don't actually mind?
Both ratios lean on statistical assumptions that don't always hold:
- Sharpe implicitly assumes returns are roughly normal and that upside and downside deviations deserve equal weight.
- Sortino assumes the MAR threshold meaningfully separates "acceptable" from "harmful" volatility.
- Skewness (asymmetric return distributions) and kurtosis (fat tails) distort both ratios, just in different directions.
- Short track records inflate noise in either calculation, but especially in Sortino, since it draws from fewer data points.
Pro Tip: Before trusting either number, plot a histogram of your returns. A visibly skewed or fat-tailed distribution is your signal that neither ratio tells the whole story on its own.
Strengths and Limitations of Each Ratio
Sharpe's biggest strength is also its most common criticism: it treats every deviation from the mean as risk, upside included. That simplicity makes it easy to report and compare across managers, but it penalizes strategies that happen to have big winning months, and it gets distorted by non-normal return distributions and outliers.
Sortino's advantage is intuitive appeal. It only counts the volatility investors actually dislike, which better matches how most people describe their own risk tolerance, according to Schwab's education content on the ratio. Its weakness is statistical: because it discards roughly half the dataset (the upside half), it has reduced information density and grows unreliable for short or infrequent-loss return series, per Wikipedia's overview of the Sharpe ratio family.
- Sharpe: simple, widely reported, uses the full dataset; penalizes upside, distorted by fat tails.
- Sortino: matches investor psychology, isolates real risk; noisier with small samples, blind to upside information.
- Neither ratio should be a standalone decision rule.
Statistical warning: simulated or smoothed return series (common in illiquid assets like private equity) artificially compress volatility and inflate both ratios. Pair either metric with maximum drawdown and a distribution check before trusting the headline number.
How Do Sharpe and Sortino Diverge in Practice?
Sharpe = (8−2)/6 = 1.0. Sortino = (8−2)/4 = 1.5. Both ratios tell a consistent story: solid, moderate risk.
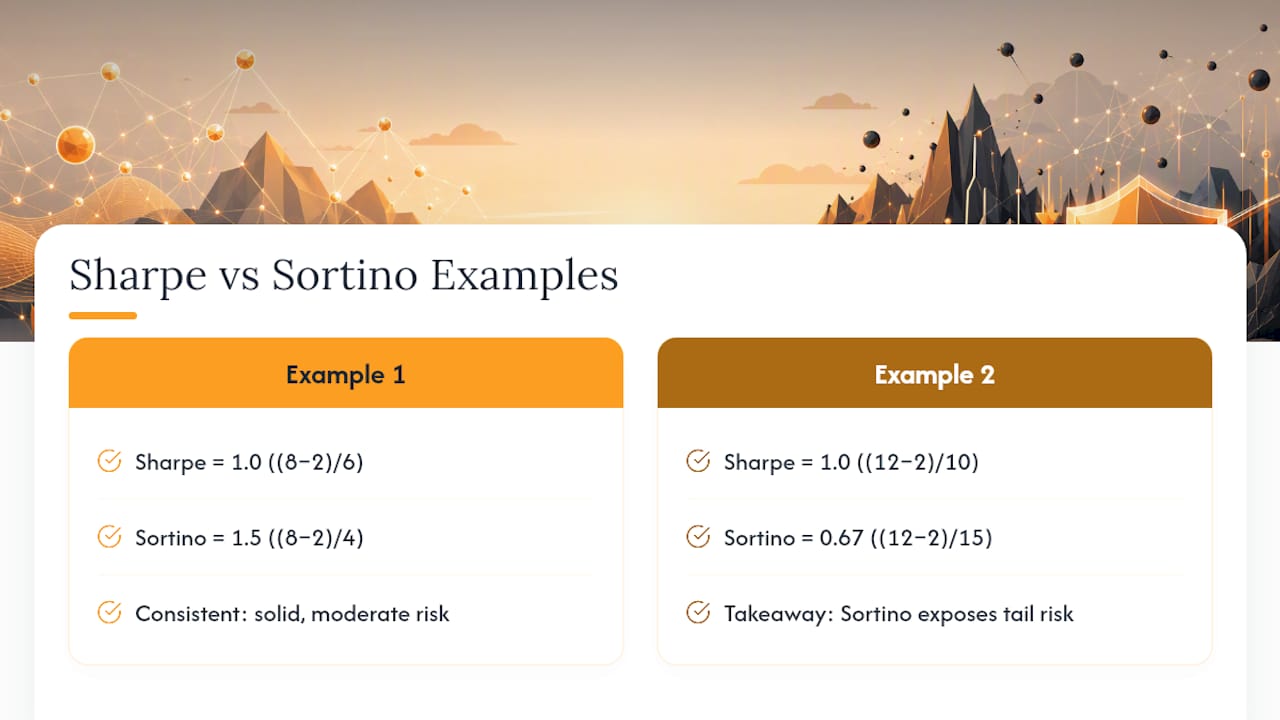
Sharpe = (12−2)/10 = 1.0. Sortino = (12−2)/15 = 0.67. Here Sortino exposes the tail risk that Sharpe's blended volatility measure hides, a pattern Creget Research's analysis of skewed distributions flags directly.
As a general benchmark, a Sharpe ratio near 1 is considered good, near 2 is very good, and 3 or higher is excellent, according to Investopedia's guidance, though asset class context always matters. A high Sortino paired with a mediocre Sharpe is a flag to dig into the return distribution before allocating further.
Should You Use Sharpe or Sortino for Your Strategy?
Ask these questions before picking a ratio:
- Does the strategy have meaningful return skew (frequent small gains, rare large losses, or vice versa)?
- How long is the track record? Under two to three years of monthly data, treat Sortino results cautiously.
- Who is the audience? Institutional screening often defaults to Sharpe for comparability; client-facing risk discussions often favor Sortino's intuitive framing.
Common mappings, echoed in industry explainers comparing performance ratios: long-only diversified funds lean on Sharpe, hedge funds with option overlays or tail exposure lean on Sortino, and retail fund screening often reports both.
- Compute both ratios whenever the return history allows it.
- Add maximum drawdown and a volatility-regime check for any strategy with derivatives exposure.
- Never rely on a single ratio to greenlight an allocation decision.
How to Calculate Sharpe and Sortino in Excel, Python, and R
In Excel, compute mean excess return with =AVERAGE(returns)-Rf, then divide by =STDEV.S(returns) for Sharpe. For Sortino, build a helper column with =MIN(0,return-MAR), square it, average those squared values, take the square root, then divide excess return by that figure.
- Python: use
pandasandnumpyfor excess returns and annualization;empyricalorpyfoliohave built-in Sharpe and Sortino functions that handle downside deviation automatically. - R: the
PerformanceAnalyticspackage includesSharpeRatio()andSortinoRatio()functions directly, avoiding manual lower-partial-moment coding. - Common pitfall: mixing log returns with simple returns, or annualizing the numerator without matching the denominator's frequency.
Centralizing your stock and ETF return history in one place, rather than stitching together broker exports, removes most of the frequency-mismatch errors that quietly corrupt these calculations.
Do More With Your Portfolio Data
Calculating Sharpe and Sortino by hand only works if your return data is clean, complete, and consistently timestamped across every account. That's rarely how most portfolios look once they span a brokerage, a crypto wallet, and a few manual entries for real estate or private holdings.
Evibe consolidates stocks, ETFs, options, crypto, real estate, and other assets into one dashboard with automatic syncing from banks and brokerages, so the return series feeding your risk metrics reflects your actual portfolio, not an approximation. Its AI-driven analysis surfaces risk and diversification signals alongside benchmarking against major indices, giving you a faster read on performance than building spreadsheets from scratch. Evibe's tracking tools are free to use, with 7 days of Premium on every new account.

Sharpe vs Sortino: Which Risk-Adjusted Ratio Should Investors Use?
The conventional advice treats this as a binary choice: pick Sharpe for simplicity or Sortino for sophistication. That framing misses the real lesson from the data. Because the two ratios correlate so strongly across most managers, the debate over which one is "better" is often a distraction from a more useful habit: checking your return distribution before trusting either number.
What gets underestimated is how badly both ratios perform on short track records and smoothed return series. A fund with eighteen months of monthly data and one lucky quarter can post an impressive Sharpe or Sortino that says almost nothing about future risk. I'd rather see an investor compute both ratios, glance at the skew, and check maximum drawdown, than debate ratio philosophy for an hour. The metric matters less than the discipline of testing it against the shape of the actual returns behind it.
This article is general information, not a substitute for advice from a qualified financial advisor. Consult a qualified financial professional about your own circumstances before acting on anything here.
Sources
Sharpe and Sortino rankings move together often enough that many analysts stop checking for the exceptions, which is precisely when a skewed return stream slips through unnoticed.